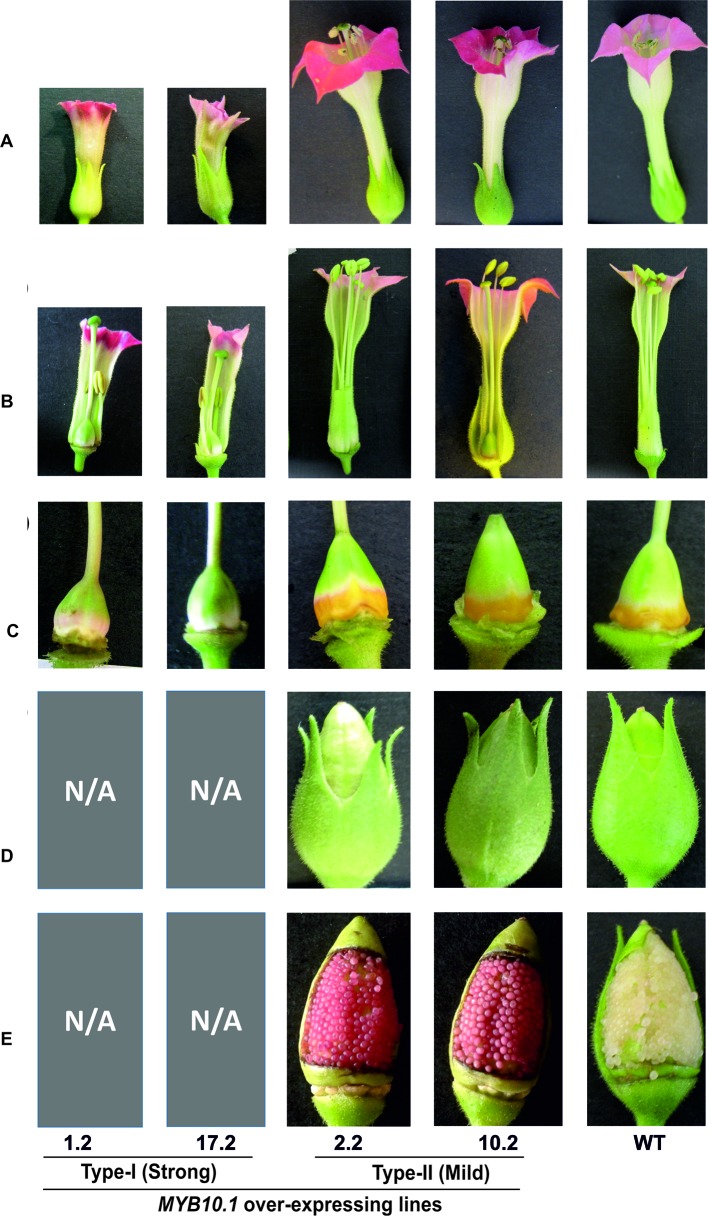
Figure 4.
Floral phenotypes of MYB10.1 overexpressing transgenic tobacco lines compared to WT. (A) Complete flowers; (B) open flowers showing the anther-stigma distance; (C) nectary region of the ovary, missing in strong lines; (D) green capsules; and (E) open capsules showing seed coat pigmentation, reddish in mild phenotypes. N/A indicates the absence of capsules and ovules/seeds in type I transgenic plants.

