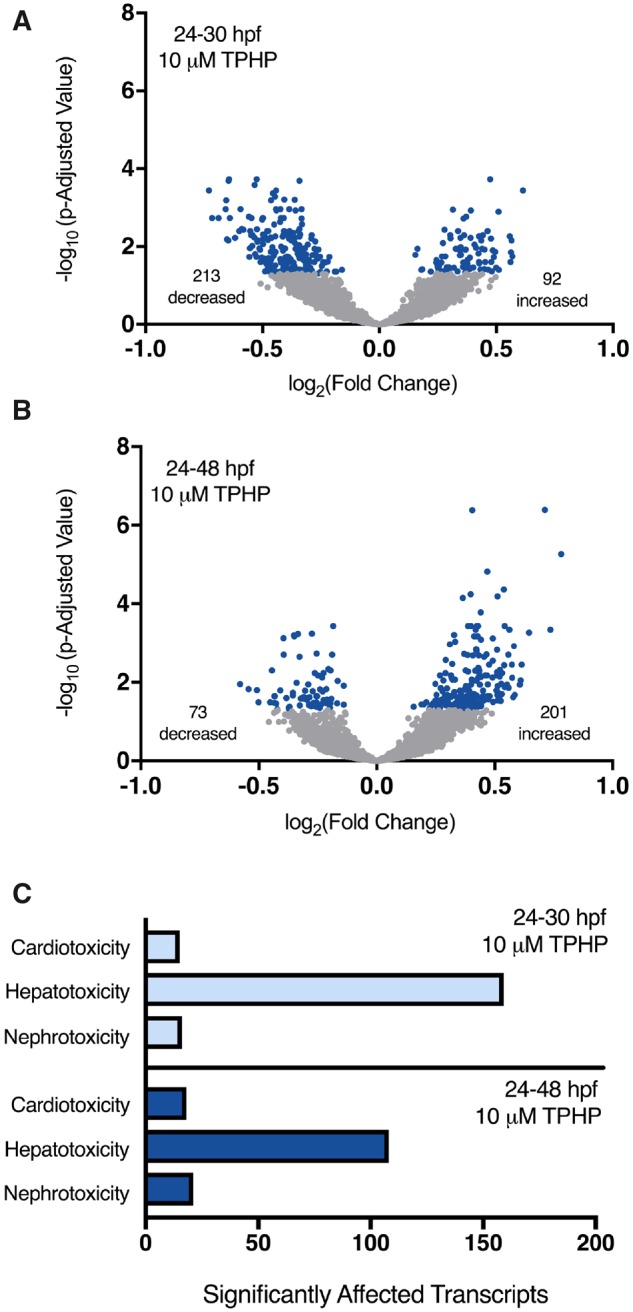
Figure 2.

Volcano plots showing the number of significantly different transcripts (dark circles) following treatment with 10 μM TPHP (triphenyl phosphate) from 24 to 30 hpf (A) or 24 to 48 hpf (B) relative to vehicle (0.1% DMSO) controls. Log2-transformed fold change is plotted on the x-axis and log10-transformed p-adjusted value is plotted on the y-axis. Transcripts associated with cardiotoxicity-, hepatotoxicity-, and nephrotoxicity-related pathways were identified by ingenuity pathway analysis’s (IPA’s) toxicity analysis using a Fisher’s Exact p-value of ≤ .05 (C).
