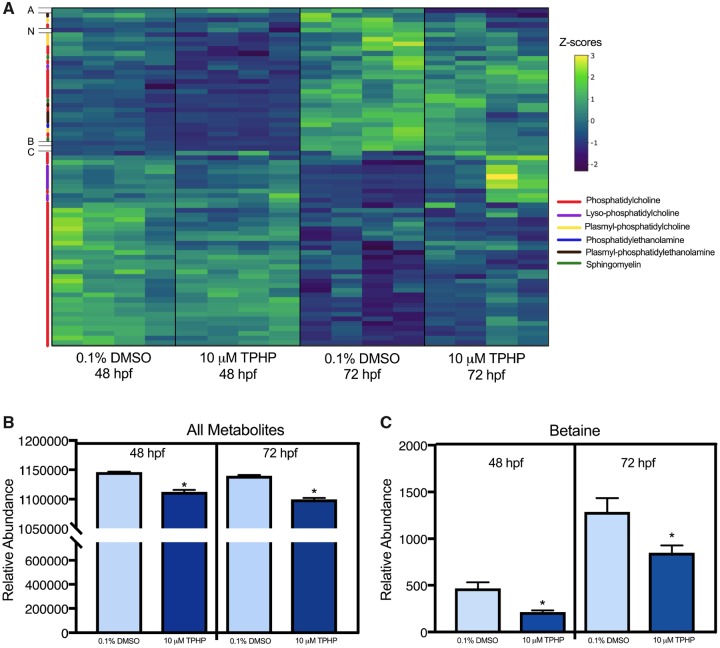
Figure 8.
Untargeted metabolomics analysis (A) of 48- and 72-hpf embryos treated with either vehicle (0.1% DMSO) or 10 μM TPHP (triphenyl phosphate) from 30 to 48 hpf or 30 to 72 hpf, respectively. Data shown within the heat map are z-scored. Each column represents an individual biological replicate, each row represents an individual metabolite, and each color on the y-axis represents a different metabolite class represented within the legend to the right. Acylcarnitine 22:6 (A), N-acetylhistidine (N), betaine (B), and cholesterol/lathosterol (C) did not fall within any of the broader metabolite classes. Relative abundance (± standard deviation) of all metabolites (B) and betaine (C) within 48- and 72-hpf embryos treated with either vehicle (0.1% DMSO) or 10 μM TPHP from 30 to 48 hpf or 30 to 72 hpf, respectively.

