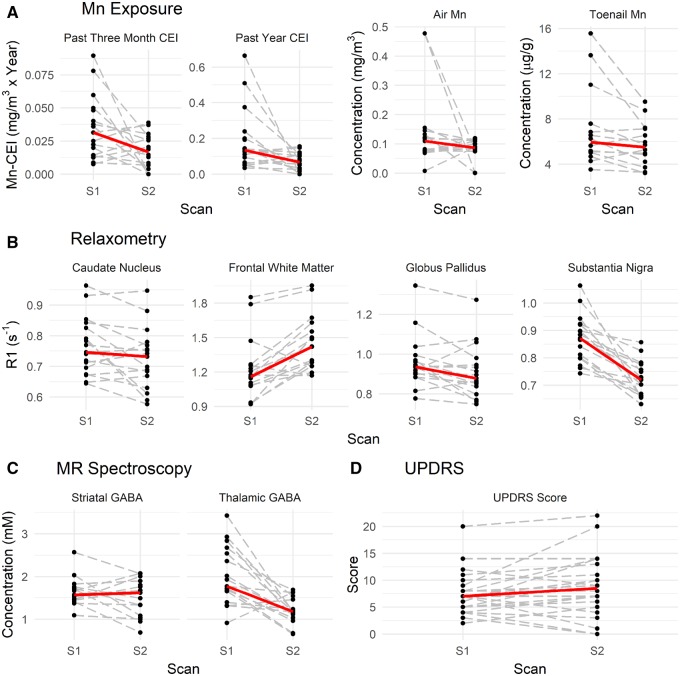
Figure 2.
Changes in welders between Scan 1 (S1) and Scan 2 (S2). A, Changes in past 3 months cumulative exposure indexes (CEI) (Mn-CEI3M), past year CEI (Mn-CEI12M), air Mn concentration ([Mn]Air), and toenail Mn concentration ([Mn]Toenail). B, Changes in R1 in 4 different regions of interest in the brain: caudate nucleus, frontal white matter, globus pallidus, and substantia nigra. C, Changes in γ-aminobutyric acid (GABA) levels in 2 regions of the brain: striatum and thalamus. D, Less changes are observed in Unified Parkinson’s Disease Rating Scale (UPDRS) scores. Median trends are the solid line (in red).

