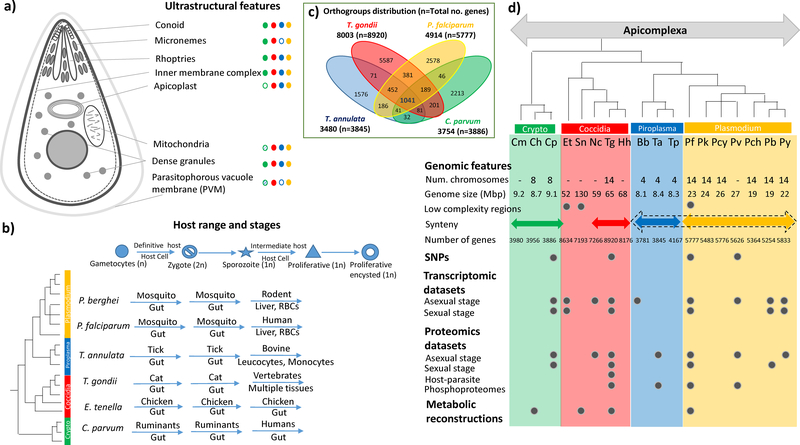
Figure 1: Ultrastructure, Life Cycle, and Genome Structure of Apicomplexa –
The figure highlights details of ultrastructural details unique to apicomplexa, along with their distribution in major clades (Green – Cryptosporidia, Red – Coccidia, Blue – Piroplasmida, Yellow – Plasmodium). Unusual organelles are shown as shaded ellipses – extracytoplasmic PVM (1) and reduced mitochondria-like organelles (2) in Cryptosporidium species. The various life cycle stages are listed along with the host and tissue range common for specific members of each clade in the quadrant below. A venn diagram representing the distribution of orthologous groups among four representative apicomplexans of the major clades is shown. On the right hand side, various genome sequence features as well as details of available functional datasets for sequenced genomes are listed. The species tree for the apicomplexan organisms used in this analysis is shown (based on http://tolweb.org, (3), (4)). The apicomplexan species listed are: Cm – Cryptosporidum muris, Ch – Cryptosporidium hominis, Cp – Cryptosporidium parvum, Et – Eimeria tenella, Sn – Sarcocystis neurona, Nc – Neospora caninum, Tg – Toxoplasma gondii, Hh – Hammodia hammondi, Bb – Babesia bovis, Ta – Theileria annulata, Tp – Theileria parva, Pf – Plasmodium falciparum, Pk – Plasmodium knowlesi, Pcy – Plasmodium cynomolgi, Pv – Plasmodium vivax, Pch – Plasmodium chabaudi, Pb – Plasmodium berghei, Py – Plasmodium yoelii.

