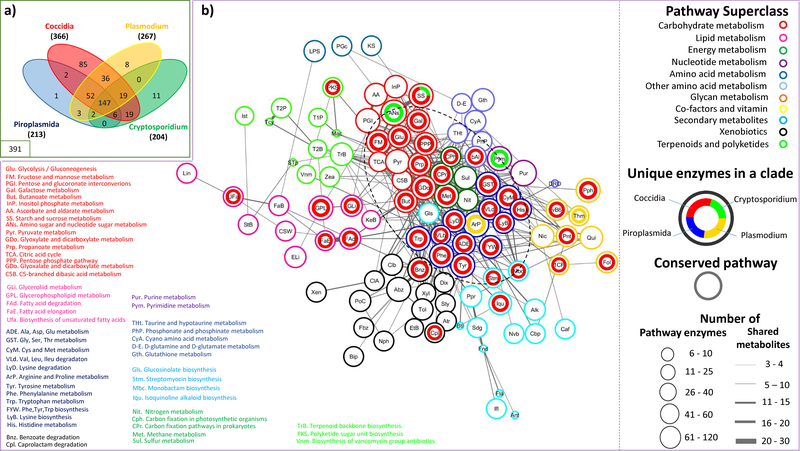
Figure 2: Metabolic potential in apicomplexan clades –
The venn diagram represents the distribution of enzymes common to all apicomplexans, shared between various clades, and unique to each clade. The distribution of conserved pathways and pathways with clade-specific enzymes (≥2 in a clade) is represented as a network. The network represents KEGG pathways (nodes) connected by number of shared metabolites, with pathways belonging to a superclass (same border colours) grouped together wherever possible. Each node is represented as a circos chart depicting the number of unique enzymes present in each major clade. Conserved pathways are indicated as empty circles. The core of the network, enclosed in a dashed circle, mainly encompasses pathways from amino acid, carbohydrate, energy, and nucleotide metabolism, with quite a few conserved pathways, as well as several clade-specific pathways, especially from coccidia. The abbreviated pathway names are expanded for those in the core, and the pathways with unique enzymes, in the periphery.

