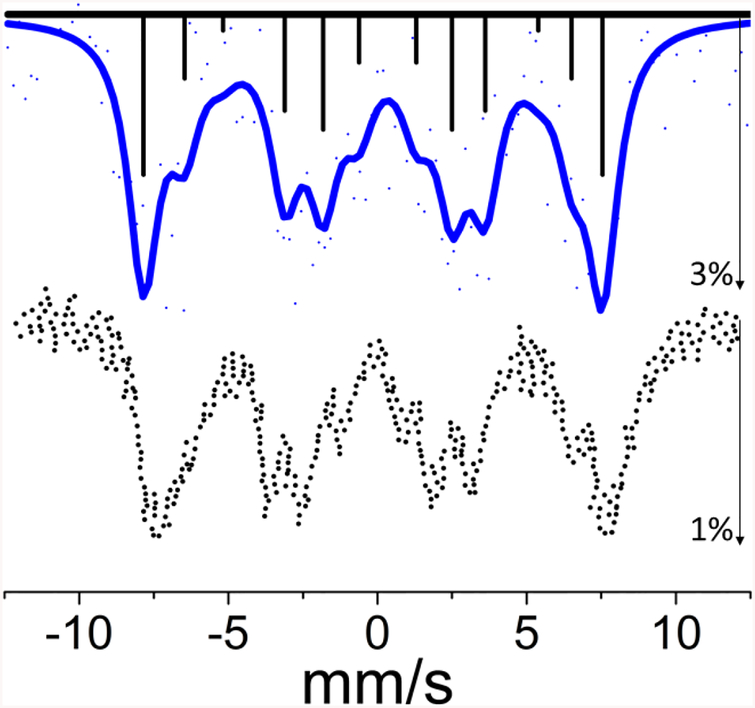
Figure 1.
Top: The experimental SR-MS spectrum of NiCr2O4 powder (points) and a simulation (solid line) using an internal hyperfine field of 44.6 T. The pattern of four sets of three partially resolved magnetic hyperfine lines results from Zeeman splitting of I=3/2 ground state and I=5/2 excited state. The sticks represent individual transition contributions, solid line represents the fit and dots indicate actual data. The maximum intensity decrease was about 3%. Bottom: a recreation of the previously reported spectrum obtained with a radioactive source.46

