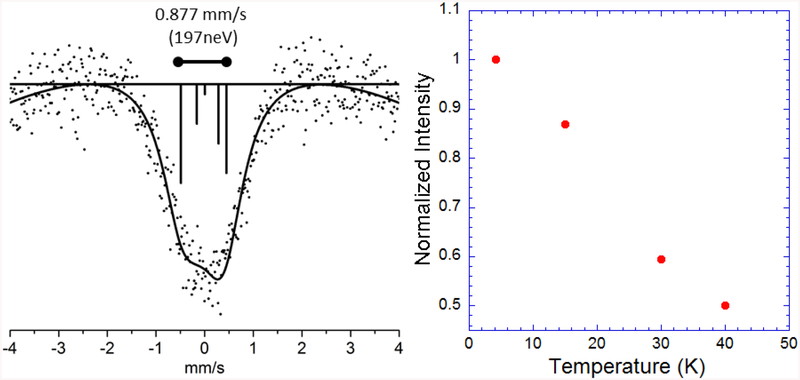
Figure 2.
Left: The 61Ni Mössbauer spectrum for the linear nickel complex 2. The solid line represents the fit and the vertical lines represent the energy and relative intensity of the individual transitions. The distance between the furthest transitions is shown above the spectrum in mm/s and neV. Right: A plot of the of the normalized integrated intensity for 4.2K, 15K, 30K, and 40K relative to the 4.2K integrated intensity.

