
Fig. 9.
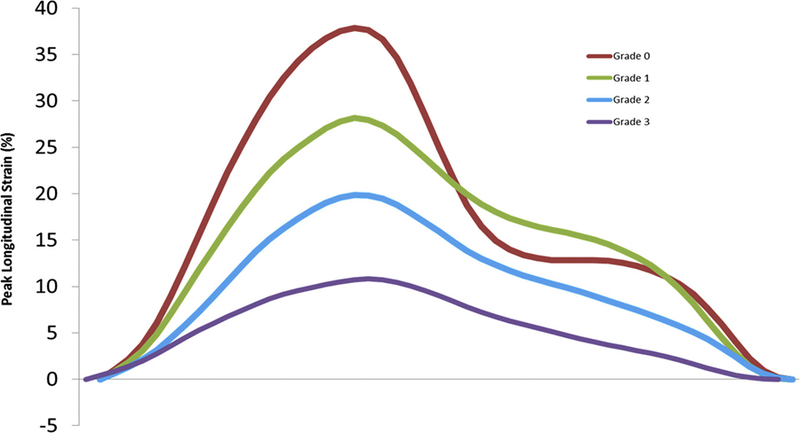
Peak longitudinal strain curves are depicted as the mean of each subgroup of diastolic dysfunction from grade 0 to grade 4. Diastolic dysfunction grade based on the 2009 ASE guidelines.
Official websites use .gov
A
.gov website belongs to an official
government organization in the United States.
Secure .gov websites use HTTPS
A lock (
) or https:// means you've safely
connected to the .gov website. Share sensitive
information only on official, secure websites.
Peak longitudinal strain curves are depicted as the mean of each subgroup of diastolic dysfunction from grade 0 to grade 4. Diastolic dysfunction grade based on the 2009 ASE guidelines.