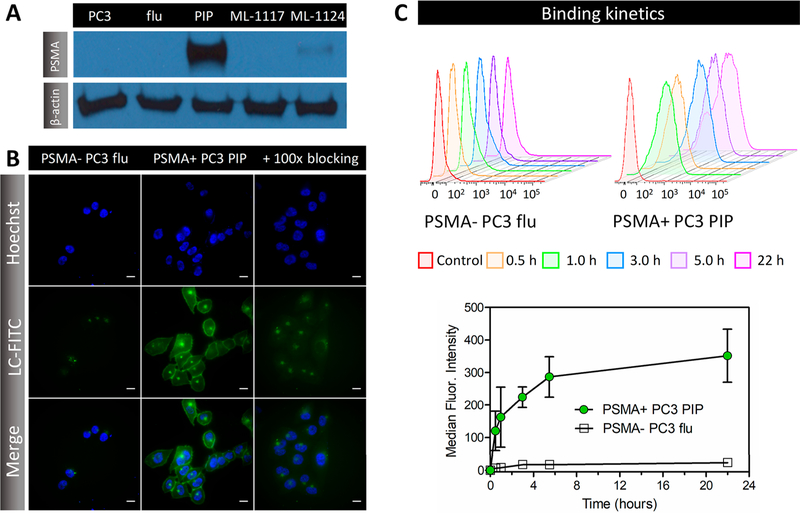
Figure 3.
PSMA targeting selectivity and specificity in vitro. (A) Western blots of PC3, PSMA- PC3 flu, PSMA+ PC3 PIP, PC3- ML-1117, and PC3- ML-1124 cell lysates using anti-PSMA and β-actin antibodies. (B) Representative fluorescence micrographs of LC-FITC (3 μM, 3 h incubation) uptake in PSMA- PC3 flu and PSMA+ PC3 PIP cells in the presence of 100× excess DCIBzL for target blockade. Scale = 25 μm. (C) Representative flow cytometry histogram plots with time-dependent quantification of LC-FITC uptake in PSMA- PC3 flu (open black square) and PSMA+ PC3 PIP (solid green circle) cells. Each point represents the median ± SD of three independent measurements.

