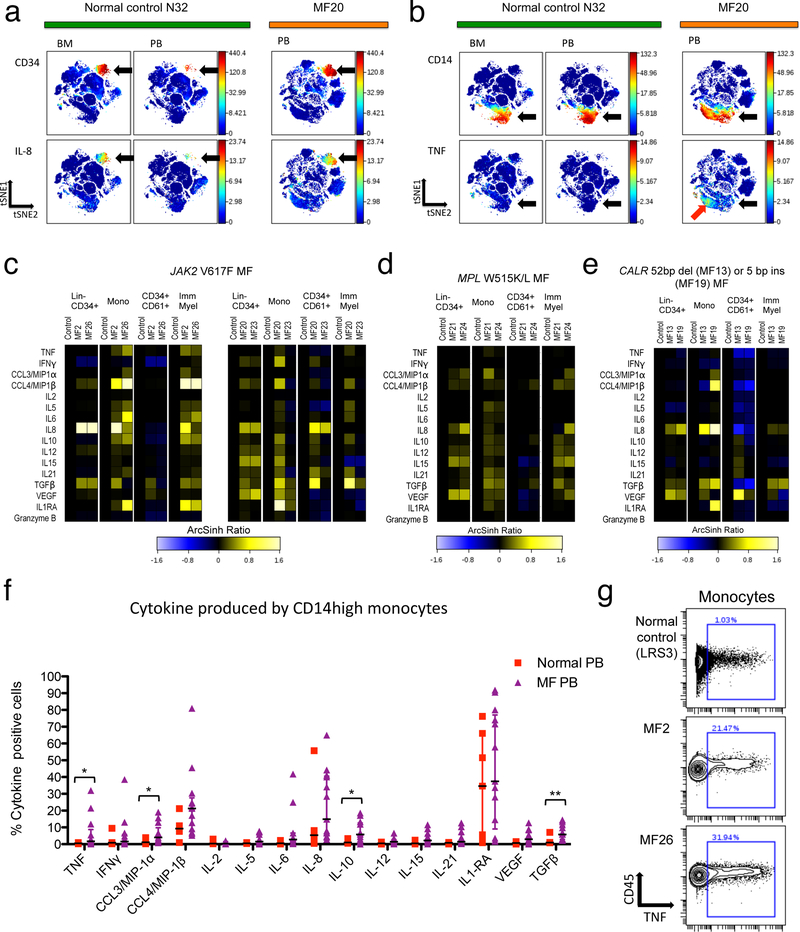
Figure 2. Cytokine overproduction in MF myeloid cell populations.
a-d: viSNE analysis comparing normal control N32 bone marrow, N32 blood, and blood from MF20 (JAK2 V617F mutant PMF). a. CD34 (upper panels) and CXCL8/IL-8 (lower panels) are shown, with arrows indicating HSPC. b. CD14 (upper panels) and TNF (lower panels) are shown, with black arrows indicating monocytes and red arrow indicating a subset of monocytes expressing TNF in MF20 blood. c-e. Heat maps showing median staining for 15 cytokines plus granzyme B, normalized to normal control blood levels (left column of each panel) on ArcSinh ratio scale.16 Heat map panels show (left to right) blood from two MF patients versus one healthy control (from an individual experiment) for the cell populations: Lin-CD34+ HSPC, CD14+ monocytes (Mono), CD34+CD61+ megakaryoblasts, and CD11b+CD11c+CD34- immature myeloid cells (Imm Myel). c. JAK2 V617F mutant MF patients MF2, MF26, MF20, and MF23 versus controls. d. MPL mutant patients MF21 and MF24 versus controls. e. CALR mutant patients MF13 and MF19 versus controls. f. Percent of monocytes manually gated as clearly positive for expression of each of the 15 cytokines. Plots show samples for normal peripheral blood (N=7) and MF blood (N=13: 7 JAK2 V617F mutant, 4 CALR mutant, 2 MPL W515L/K mutant). Error bars indicate median +/− interquartile range. Significance was determined by Mann-Whitney U-test: *, P<0.05; **, P<0.01. g. Biaxial plots illustrating positive versus negative gating (as used in f and Supplementary Figure S7) for TNF from a normal blood control sample and two JAK2 V617F mutant MF patients.

