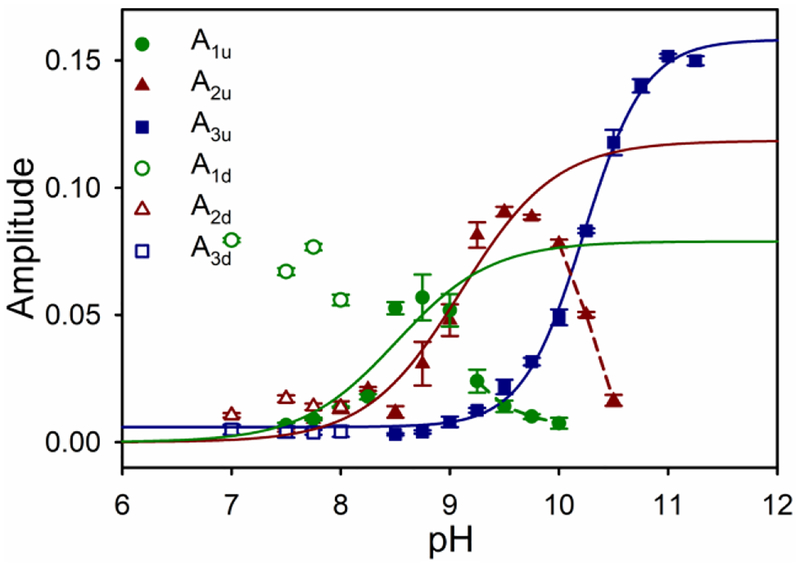
Figure 6.
Plots of amplitude versus pH for the three kinetic phases observed for the alkaline conformational transition of A51V Hu Cytc. Color scheme is the same as for Figure 5. Filled symbols are used for upward pH jumps (A1u, A2u and A3u). Open symbols are used for downward pH jumps from pH 10.5 (A1d, A2d and A3d). Data points are the average and standard deviation of a minimum of five trials. A1u versus pH and A2u versus pH data were fit to eq 6 in the Discussion (solid lines). In these fits, kb and kf in eq 6 were set equal to the values determined from the fits of kobs versus pH to eq 5 in Figure 5. Data points connected with dashed lines were not included in these fits. A3u versus pH data were fit to Henderson-Hasselbalch equation (solid line).

