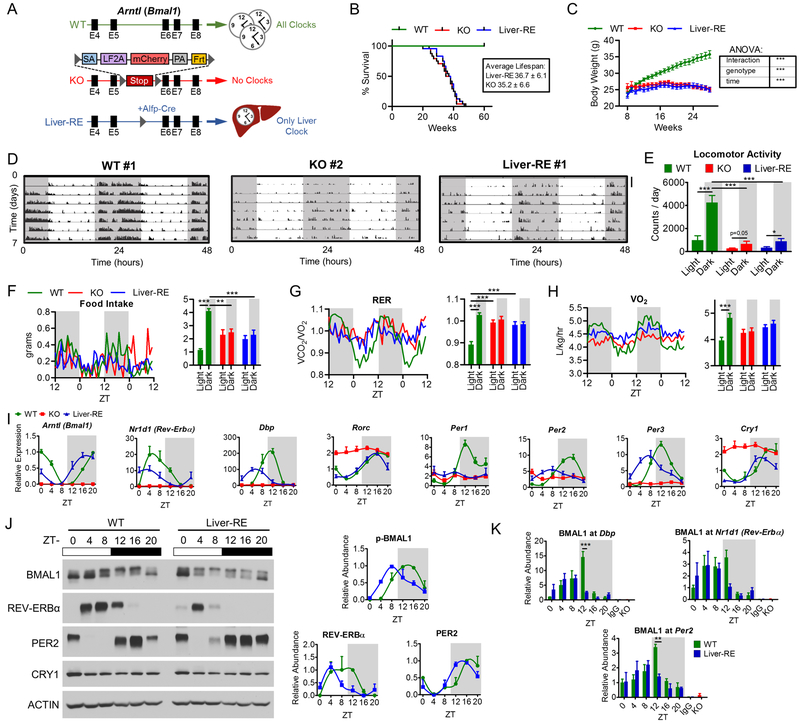
Fig. 1. Reconstitution of the liver clock using Bmal1-Stop-FL mice.
A) Scheme of genetic reconstitution of the liver clock. See also Fig. S1A–B. B) Survival curves, WT n=25; KO n=24; Liver-RE n=24. C) Progression of body weight, WT n=27; KO n=39; Liver-RE n=27. Two-way ANOVA, ***=p<0.001. D-E) Locomotor activity in LD cycle. D) Representative trace, duplicated over 2 days for visualization; scale bar = 30 counts. E) Group quantification, n=5. Two-way ANOVA, *=p<0.05; ***=p<0.001. See also Fig. S1C. F-H) Metabolic cage assessment of mice in LD. Traces of group averages (left) and light phase (ZT0–12)/dark phase (ZT12–24) averages (right). RER – respiratory exchange ratio. WT n=8; KO n=5; Liver-RE n=7. Two-way ANOVA, **=p<0.01; ***=p<0.001. See also Fig. S1D–E. I) Gene expression in liver; n=4. See also Fig. S1F. J) Protein levels in liver whole-cell extracts. Right, quantification of n=3. See also Fig. S1G. J) ChIP-qPCR for BMAL1 recruitment to promoters, n=4. IgG and KO negative controls are from ZT20. Two-way ANOVA, **=p<0.01; ***=p<0.001.

