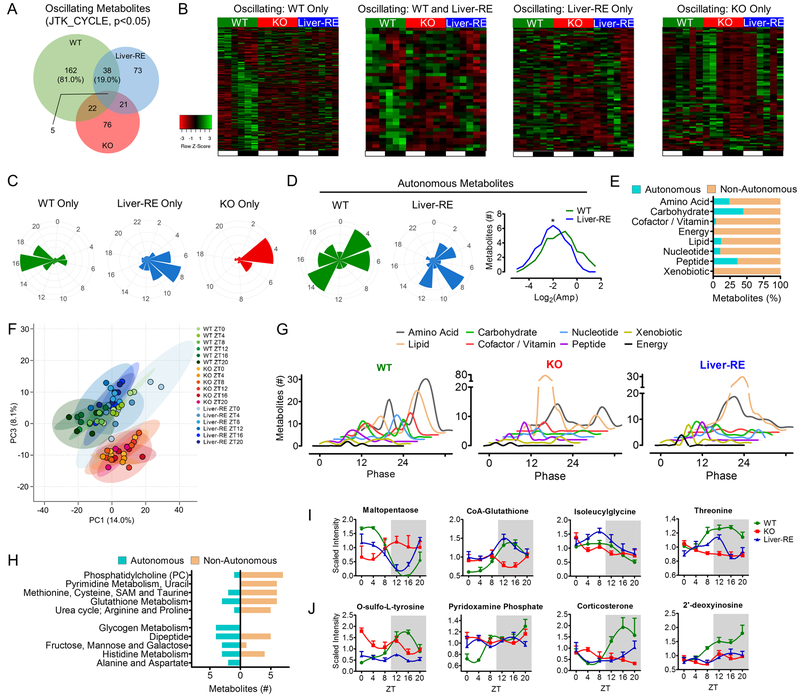
Fig. 2. Diurnal metabolome reveals autonomous metabolic output.
A) Overlap of oscillating metabolites from liver obtained at 6 time-points over 12 hr LD cycle. Percentages are of the total number of Bmal1-dependent metabolites oscillating in WT, n=4. See also Fig. S2A. B) Phase sorted heatmaps of distinct groups of oscillating metabolites. C) Polar histogram plots of peak phase for oscillating metabolites. D) Polar histogram plots of peak phase for autonomously oscillating metabolites (left) and amplitude histogram (right). See also S2B. E) Chemical classification of oscillating metabolites, presented as % of total oscillating for that class. See also S2C–D. F) Principal component analysis of metabolites at each time-point. G) Histograms showing the peak phase of oscillating metabolites in each class. H) Metabolic process or pathway for oscillating metabolites (top 5), see also Table S1. I-J) Examples of autonomously (I) and non-autonomously (J) oscillating metabolites. See also S2E.

