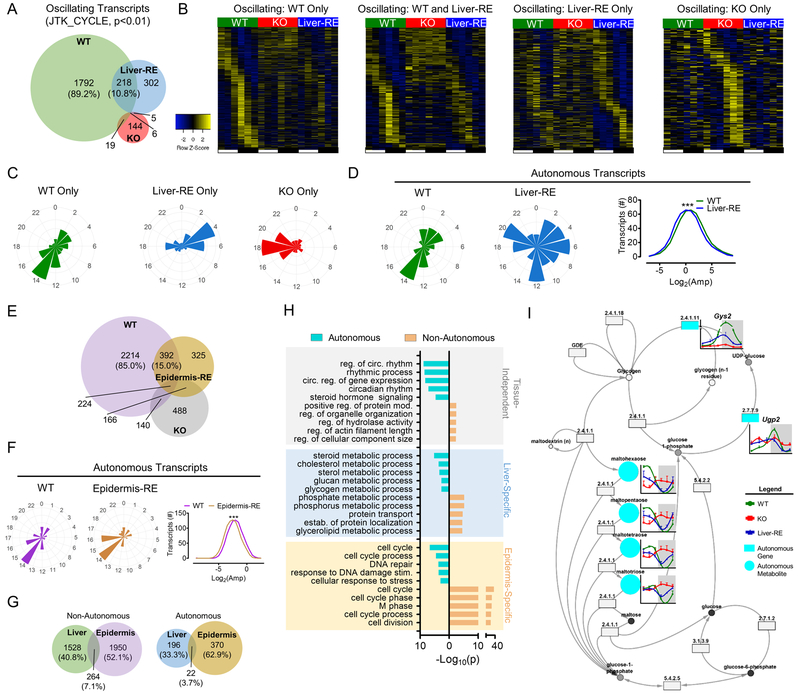
Fig. 3. Autonomous transcriptional output of peripheral clocks is tissue-specific.
(A) Overlap of oscillating liver transcripts in a 12 hr LD cycle. Percentages are of the total number of Bmal1-dependent transcripts oscillating in WT; n=3. See also Fig. S3A. B) Phase sorted heatmaps of distinct groups of transcripts. C) Polar histogram plots of peak phase for oscillating transcripts. D) Polar histogram plots of peak phase for autonomously oscillating transcripts (left) and amplitude histogram (right). See also S3D. E) Overlap of oscillating transcripts in epidermis of WT, KO and epidermis reconstituted (Epidermis-RE) mice (Welz et al.). Percentages are of the total number of oscillating transcripts in WT, JTK – p<0.01; n=3–4. F) Polar histogram plots of peak phase and amplitude histogram for autonomously oscillating transcripts in epidermis. See also Fig. S3F. G) Overlap of oscillating transcripts between Liver-RE and Epidermis-RE. Percentages are of the total number of oscillating transcripts. H) GO Biological Process enrichment analysis of oscillating transcripts, grouped by tissue-specificity and autonomy (top 5), see also Table S4. I) Example of cohesively autonomous pathway – glycogen metabolism (KEGG). Metabolites = circles; genes = rectangles, EC number is given for specific enzymatic activity. See also Fig. S3G.

