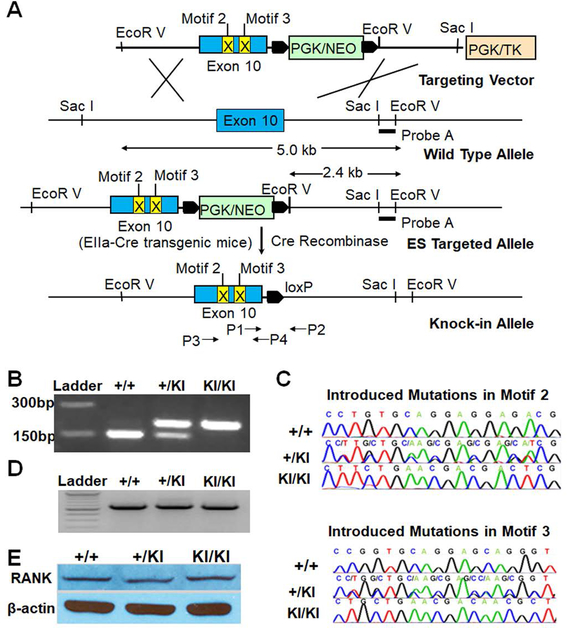
Fig. 1.
Generation, genotyping and validation of the KI mice. (A) The targeting strategy. (B) Genotyping by PCR using primers P1 and P2 shown in Fig. 1A. This pair of primers yields 160 bp PCR products from WT allele. The presence of a LoxP site in the KI allele results in 200 bp products. (C) Sequencing results of PCR products amplified using P3 and P4 shown in Fig. 1A and genomic DNA isolated from RANK+/+, RANK+/KI and RANKKI/KI mice. (D) Semi-quantitative RT-PCR analysis of RANK mRNA levels in BMMs from RANK+/+, RANK+/KI and RANKKI/KI mice. The assay was independently repeated twice. (E) Western blot analysis of RANK protein levels in BMMs from RANK+/+, RANK+/KI and RANKKI/KI mice. The assay was independently repeated twice.

