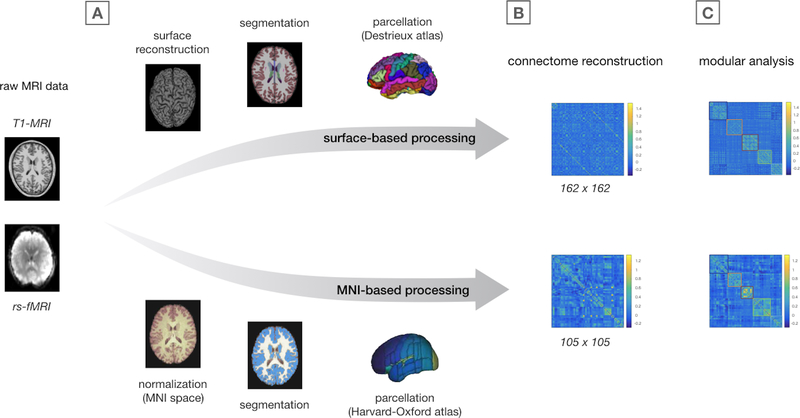
Figure 1.
Image preprocessing and connectome analysis steps
Overview of image preprocessing (A), connectome reconstruction (B), and modular community detection analysis (C). Of note, the colors of the modules shown in the connectivity matrices in panel C correspond to the modules as shown in Figure 2A.

