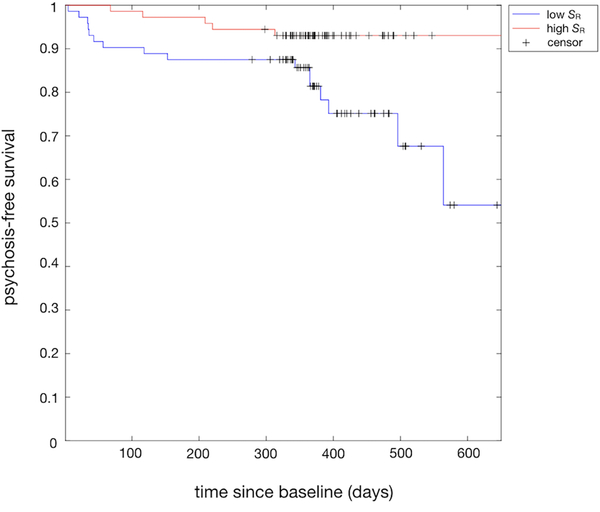
Figure 4.
Psychosis-free survival for typical vs. atypical baseline connectome organization
Kaplan-Meier plot showing psychosis-free survival functions for CHRs with above-average (red) and below-average (blue) levels of SR (reflecting typical and atypical connectome organization respectively) as a functional of time since baseline (days).

