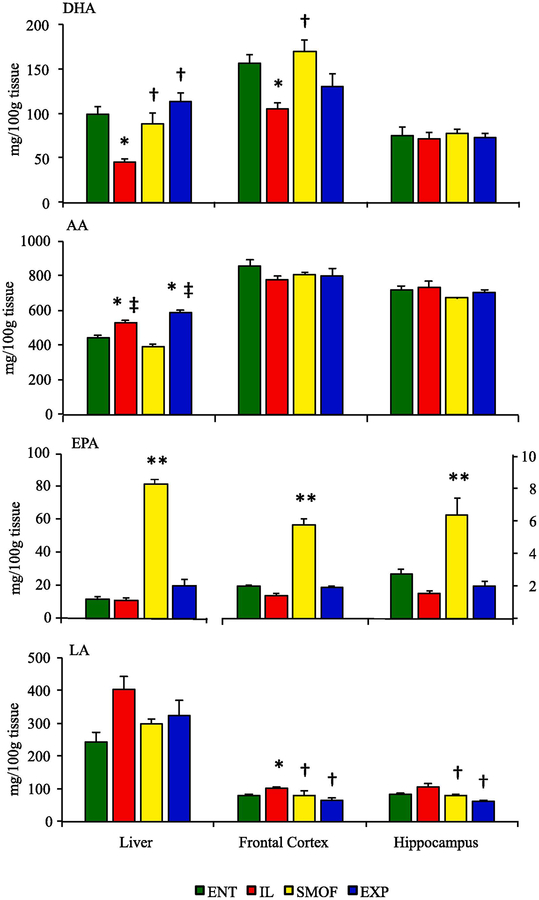
Fig. 2.
Fatty acid content in liver, frontal cortex and hippocampus tissue in dietary treatment groups at the end of study. Values shown are mg/100g tissue (ENT n = 11, IL n = 12, SMOF n = 11, EXP n = 11). Data are presented as mean ± SEM. * P < 0.05 v ENT, † P <0.05 v IL, ‡ P < 0.05 v SMOF, ** P < 0.05 v all groups

