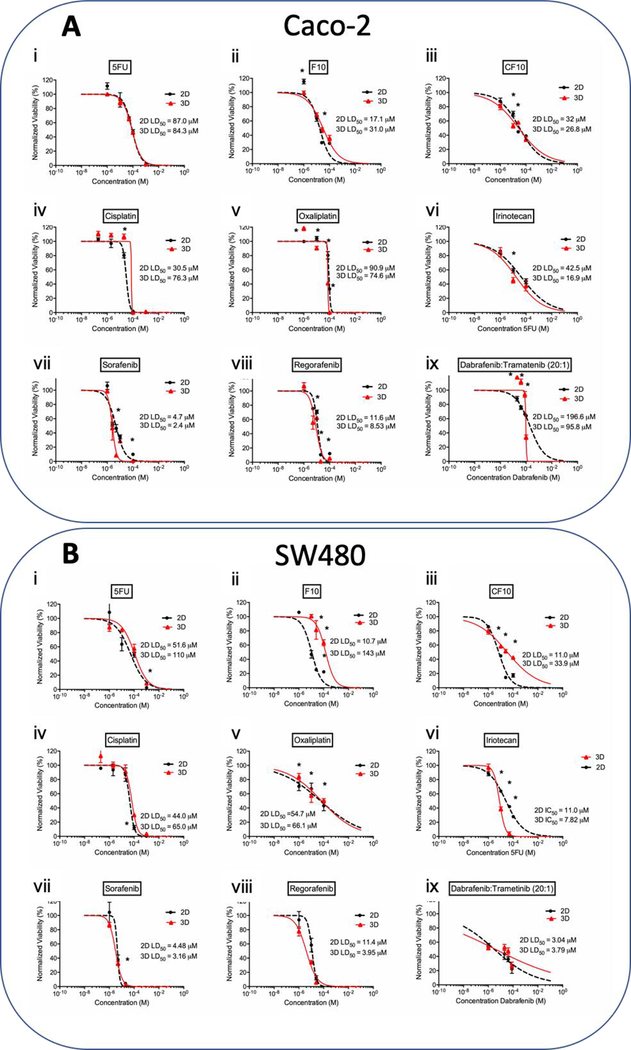
Figure 3. LD50 charts of chemotherapeutic treatments on A) Caco-2 and B) SW480 cell lines.
The effects of fluoropyrimidine based drugs i) 5FU, ii) F10, iii) CF10, platinum-based drugs iv) cisplatin, v) oxaliplatin, vi) topoisomerase I inhibitor irinotecan, small molecule inhibitors vii) sorafenib, viii) regorafenib, and ix) dabrafenib/trametinib combination treatment, on the proliferation and viability of the cell line in 2D and 3D organoid. Statistical significance: * is equivalent to p-value under 0.05 between 2D and 3D at the same dose.

