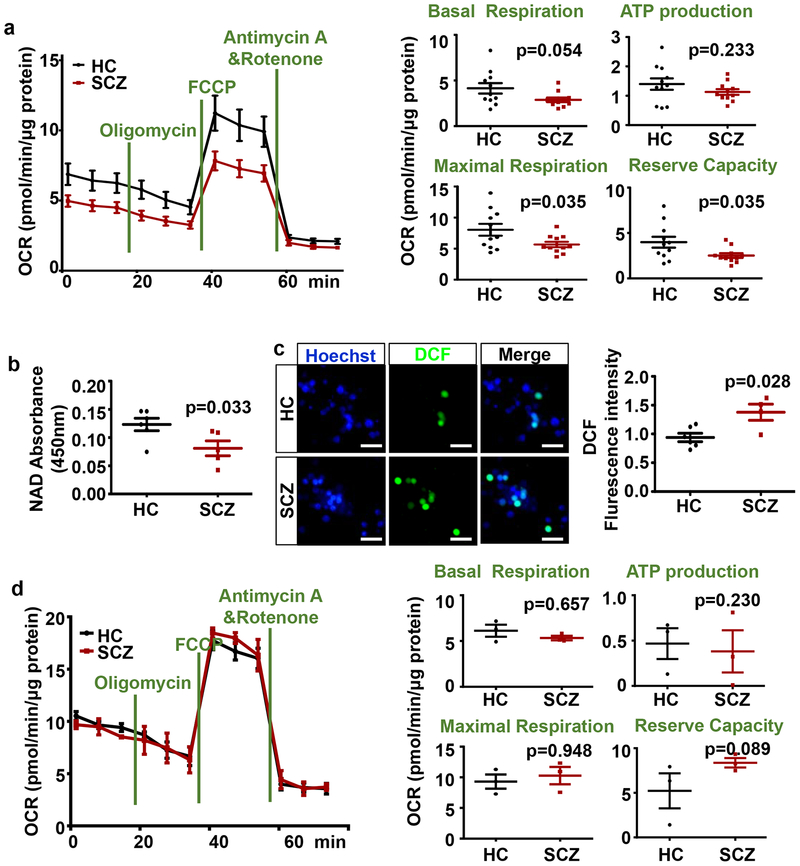
Fig 4. Dysregulation of OxPhos genes in SCZ cINs resulted in defects in mitochondrial function.
(a) Analysis of oxidative phosphorylation using Seahorse Analyzer, showing significant decrease in mitochondrial function in SCZ cINs. Data are presented as mean±SEM. Two-tailed unpaired t-test was used for analysis (n=11 lines per group, with two independent differentiations per line).
(b) NAD assay in HC vs. SCZ cINs. Data are presented as mean±SEM. Two-tailed unpaired t-test was used for analysis (n=6 lines in HC group and 5 lines in SCZ group, with two independent differentiations per line).
(c) Decreased mitochondrial function in SCZ cINs resulted in increased oxidative stress, assayed by DCF assay. Scale bar=20 μm. Data are presented as mean±SEM. Two-tailed unpaired t-test was used for analysis (n=6 lines in HC group and 4 lines in SCZ group, with two independent differentiations per line).
(d) Analysis of oxidative phosphorylation using Seahorse Analyzer, showing no significant change in mitochondrial function in SCZ glutamatergic neurons. Data are presented as mean±SEM. Two-tailed unpaired t-test was used for analysis (n=3 lines per group).

