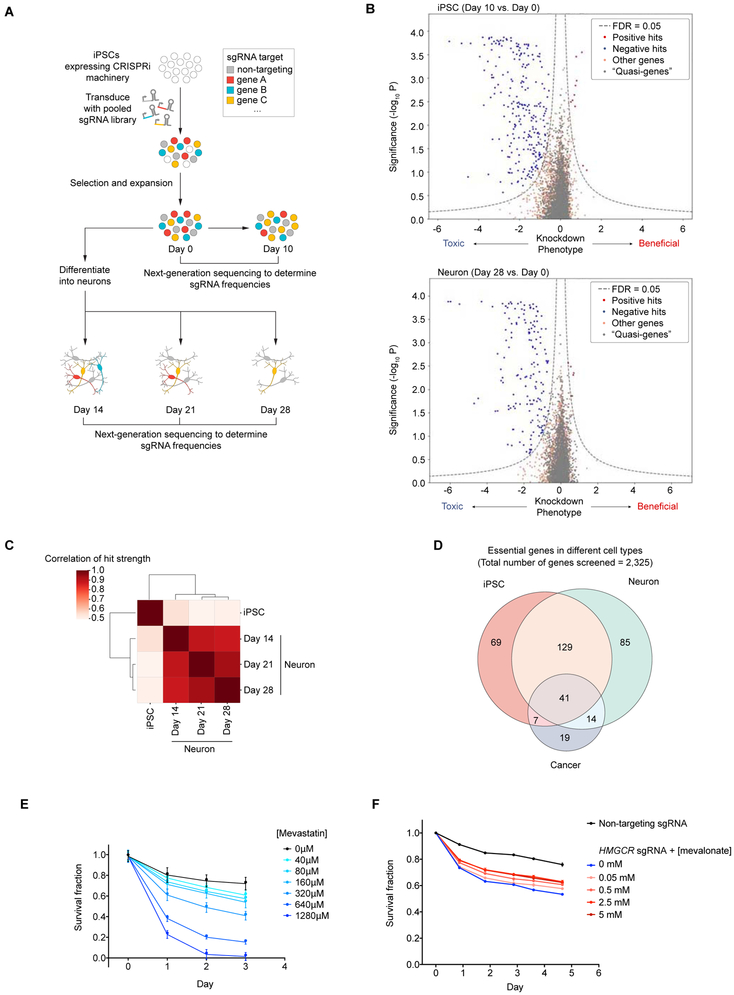
Fig. 2. Massively parallel screen for essential genes in iPSCs and iPSC-derived neurons.
(A) Strategy: CRISPRi-i3N iPSCs were transduced with a lentiviral sgRNA library targeting 2,325 genes (kinase and the druggable genome) and passaged as iPSCs or differentiated into glutamatergic neurons. Samples of cell populations were taken at different time points, and frequencies of cells expressing a given sgRNA were determined by next-generation sequencing.
(B) Volcano plots summarizing knockdown phenotypes and statistical significance (Mann-Whitney U test) for genes targeted in the pooled screen. Top, proliferation/survival of iPSCs between Day 0 and Day 10. Bottom, survival of iPSC-derived neurons between Day 0 and Day 28. Dashed lines: cutoff for hit genes (FDR = 0.05, see Methods).
(C) Correlation of hit gene strength (the product of phenotype and -log10(P value)) obtained for Day 10 iPSCs, and neurons harvested on Day 14, 21, or 28 post-induction.
(D) Overlap between essential genes we identified here in iPSCs and neurons, and gold-standard essential genes in cancer cell lines (Hart et al., 2017).
(E) Survival of neurons without treatment (black) or with various concentrations of Mevastatin (blue) quantified by microscopy; mean ± SD (six replicates).
(F) Survival of neurons infected with non-targeting sgRNA (black) or HMGCR sgRNA (blue) or HMGCR sgRNA with various concentrations of mevalonate (pink to red) quantified by microscopy; mean ± SD (six replicates).

