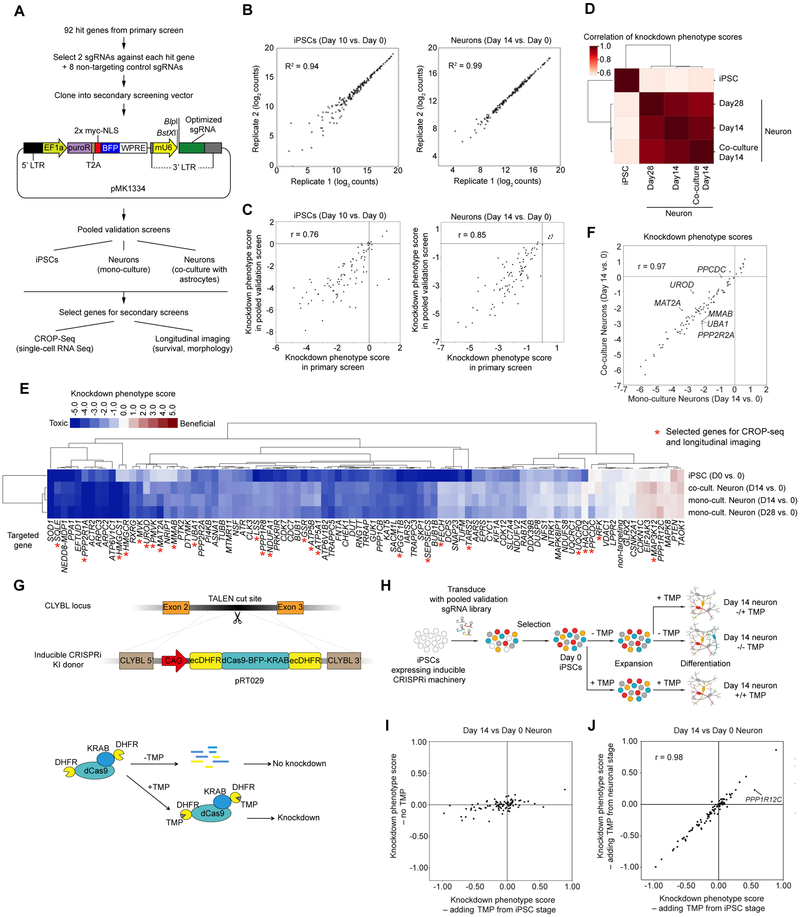
Figure 3. Pooled validation of hit genes from the primary screen.
(A) Strategy for validation of hit genes.
(B) Raw counts of sgRNAs from next-generation sequencing for biological replicates of Day 10 iPSCs (left) and Day 14 neurons (right) and coefficients of determination (R2), Each dot represents one sgRNA.
(C) Knockdown phenotype scores from primary screens and validation screens for Day 10 iPSCs (left) and Day 14 neurons (right) and Pearson correlation coefficients (r). Each dot represents one gene.
(D) Hierarchical clustering of different cell populations from the pooled validation screens based on the pairwise correlations of the knockdown phenotype scores of all genes.
(E) Heatmap showing knockdown phenotype scores of the genes targeted in the validation screen (columns) in different cell populations (rows). Both genes and cell populations were hierarchically clustered based on Pearson correlation. Red asterisks mark genes selected for secondary screens (CROP-Seq and longitudinal imaging).
(F) Gene knockdown phenotype scores of Day 14 neurons in monoculture (x-axis) and coculture with primary mouse astrocytes (y-axis) and Pearson correlation coefficient (r). Each dot represents one gene. Outlier genes, (differences > ± 2 SD from the mean differences) are labeled.
(G) Strategy for degron-based inducible CRISPRi. Addition of trimethoprim (TMP) stabilizes the DHFR degron-tagged CRISPRi machinery.
(H) Strategy to test whether hit genes control neuronal survival or earlier processes.
(I) Knockdown phenotype scores for Day 14 neurons from screens in the inducible CRISPRi iPSCs, comparing populations with TMP added from the iPSC stage (x-axis) to populations without TMP added (y-axis). Each dot represents one gene.
(J) Knockdown phenotype scores for Day 14 neurons from screens in the inducible CRISPRi iPSCs, comparing populations with TMP added from the iPSC stage (x-axis) to populations with TMP added from the neuronal stage (y-axis) and Pearson correlation coefficient (r). Each dot represents one gene. The outlier gene, PPP1R12C, is labeled.

