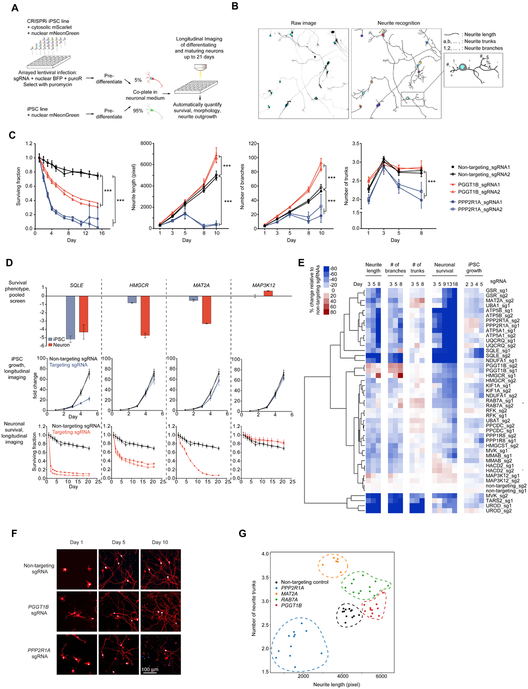
Figure 7. Longitudinal imaging to track the effect of selected hit gene knockdown on iPSC growth, neuronal survival and neurite morphology.
(A) Strategy for longitudinal imaging for neuronal survival and neurite morphology.
(B) An example illustrating the image analysis pipeline. A raw image (left) containing sgRNA positive neurons expressing nuclear BFP (cyan) and cytosolic mScarlet (greyscale) were segmented and neurites were recognized (right). Different parameters, including neurite length, number of neurite trunks and number of neurite branches were quantified for individual neurons. Total number of sgRNA positive neurons was quantified for each image to monitor neuronal survival.
(C) Quantification of knockdown effects of PGGT1B and PPP2R1A on neuronal survival, neurite length, number of branches and number of trunks. For each sgRNA, mean ± SD of replicate images is shown for each time point. *** significant differences compared to nontargeting sgRNA (P < 0.001, Student’s t-test).
(D) Examples of hit genes whose survival phenotypes in the pooled screens were validated by longitudinal imaging. Top, knockdown phenotypes of SQLE, HMGCR, MAT2A and MAP3K12 in iPSCs and neurons from the validation screens. Average phenotypes of two sgRNAs targeting each gene; error bars represent SD. Growth curves of iPSCs (middle) and survival curves of neurons (bottom) with non-targeting sgRNAs and sgRNAs targeting SQLE, HMGCR, MAT2A or MAP3K12. Fold change (for iPSCs, middle) or surviving fraction (for neurons, bottom) of number of sgRNA-positive cells relative to Day 1 was calculated for each imaging well, mean ± SD for all replicate wells for one sgRNA are shown.
(E) Changes of iPSC proliferation, neuronal survival and neurite morphology features relative to non-targeting sgRNAs at different time points (columns) induced by knockdown of different genes (rows). Rows were hierarchically clustered based on Pearson correlation.
(F) Representative images of neurons with PGGT1B and PPP2R1A knockdown on Days 1, 5 and 10. Nuclear BFP is shown in blue, cytosolic mScarlet is shown in red. Scale bar, 100 μm.
(G) Effect of gene knockdown on neurite length (x-axis) and number of neurite trunks (y-axis). Each dot indicates the mean measurements of all neurons in one image. Different target genes are shown in different colors, and replicate images for one target gene are grouped by dashed lines in the same colors.

