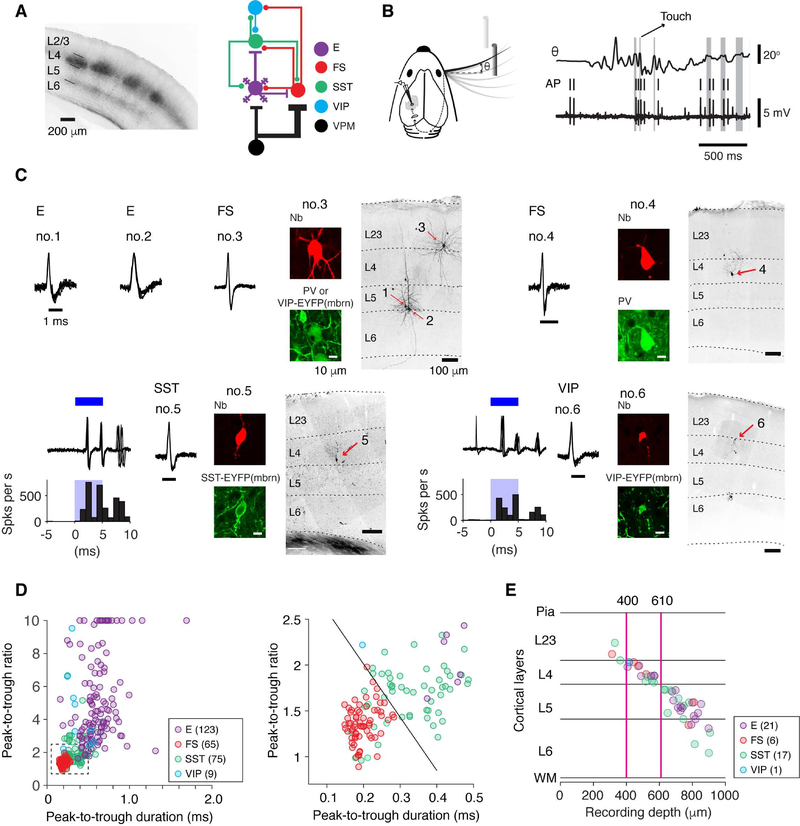
Figure 1. Cell Type-Specific Recordings during Active Tactile Behavior.
(A) Left, coronal section through the barrel cortex with labeled VPM afferents (mCherry) in L4 and the border of L5 and L6. Right, connectivity of major interneuron classes with VPM inputs and local E neurons.
(B) Left, object localization task. Mice move their whiskers to palpate a pole which is presented in one of two locations. Right, whisker position (θ) and action potentials (AP) recorded during the object localization task. Gray bars, periods of touch between the whisker and the pole.
(C) Recordings from specific cell types. Cell types (excitatory, or E; fast-spiking, parvalbuminexpressing, or FS; somatostatin-expressing, or SST; vasoactive intestinal polypeptide-expressing, or VIP) were identified based on a combination of spike waveform, immunohistochemistry, and optogenetic tagging in transgenic mice. Cells no. 1–3 were from VIP-IRES-Cre x Ai32 mice and the brain slices were immunostained against PV. In this section both VIP and PV cells emitted green fluorescence, but fluorescence in VIP cells was membrane-bound (mbrn). For cells no. 5 and 6, ChR2-based tagging is illustrated. Blue, 5-ms laser stimulation. Cells were filled with neurobiotin (Nb) by in vivo juxtacellular methods after their behavior-relevant firing patterns were collected.
(D) Spike waveform parameters for different cell types. Peak-to-trough ratios larger than 10 are plotted as 10. The number in parentheses denotes cell number in each cell type.
(E) Laminar positions of neurons recovered histologically after recordings, and the corresponding recording depth (manipulator reading). The positions are normalized to the boundaries of the layers in which the cells were identified. Magenta lines denote 400 and 610 μm, corresponding to the boundaries for L4. The number of cells is listed for each type.
See also Figure S1.

