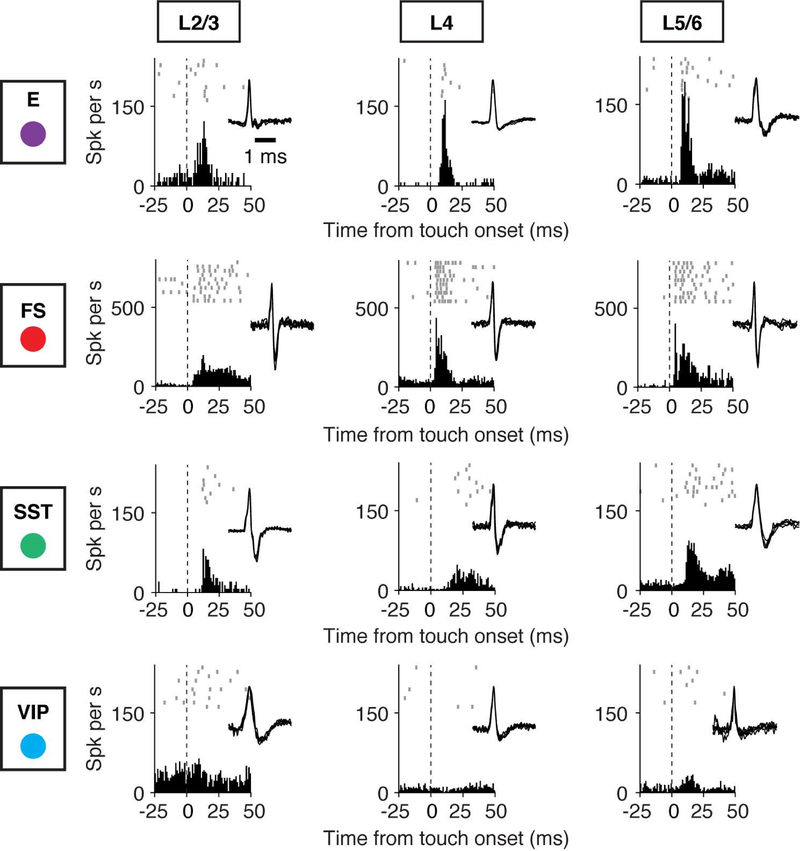
Figure 2. Cell-Type-Specific Activity Aligned to Touch Onset.
Example recordings for different cell types (E, FS, SST, VIP), arrayed vertically. Layers are arrayed horizontally. Each neuron is represented by spike raster plots across ten trials (top), the peristimulus time histogram (PSTH; bin size, 1 ms) aligned to touch onset (bottom), and the spike waveform (inset). Dashed lines denote the touch onset.
See also Figure S2.

