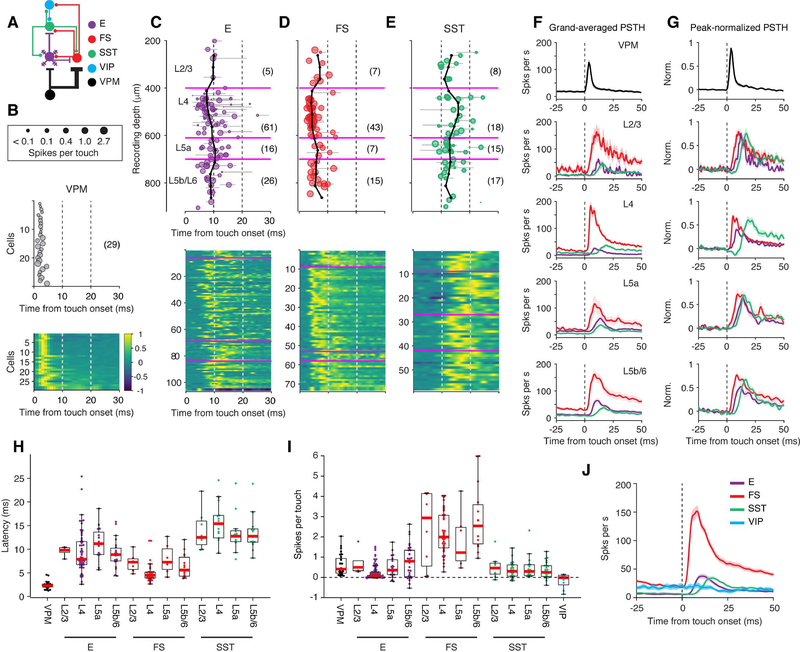
Figure 3. Touch-Evoked Spiking Responses Across Cell Types and Layers.
(A) Connectivity diagram.
(B) Response latency from touch onset for VPM neurons. Top, the size of each circle corresponds to the magnitude of the response (spikes per touch). Middle, touch latency. Bottom, peak-normalized PSTHs for all neurons. The number in parentheses denotes the number of VPM cells.
(C) Response latency from touch onset as a function of recording depth for excitatory (E) neurons. Top, the size of each circle corresponds to the magnitude of the response. Gray lines, 90% confidence interval for latency estimation for each cell. Magenta, 400, 610, and 700 μm representing the borders between L2/3 and L4, L4 and L5a, and L5a and L5b/6, respectively. Black lines, running median across cortical depth (calculated over 125 μm windows, in 50 μm steps). The number in parentheses denotes the number of cells in each layer. Bottom, peak-normalized PSTH for all neurons.
(D) Same as C, FS neurons.
(E) Same as C, SST neurons.
(F) Spike rate aligned to touch onset for different neuron types and cortical layers (grand average; shading indicates SEM). The color code and the cell number in each group is the same as in B-E.
(G) Same as F, peak-normalized.
(H) Response latency from touch onset for different neuron types and layers. VIP neurons did not respond to touch reliably and were not included. Boxplots follow the style of Tukey boxplot. Red, median; Bottom and top edges of the box, 25th and 75th percentiles, or q1 and q3; Whiskers, extreme data values within q1–1.5×(q3-q1) and q3+1.5×(q3-q1).
(I) Response magnitude for all cell types. More cells, including those whose latency could not be determined, are included for this plot.
(J) Grand-averaged PSTHs of E (n = 108), FS (n = 72), SST (n = 58), and VIP (n = 9) neurons.
See also Figures S3.

