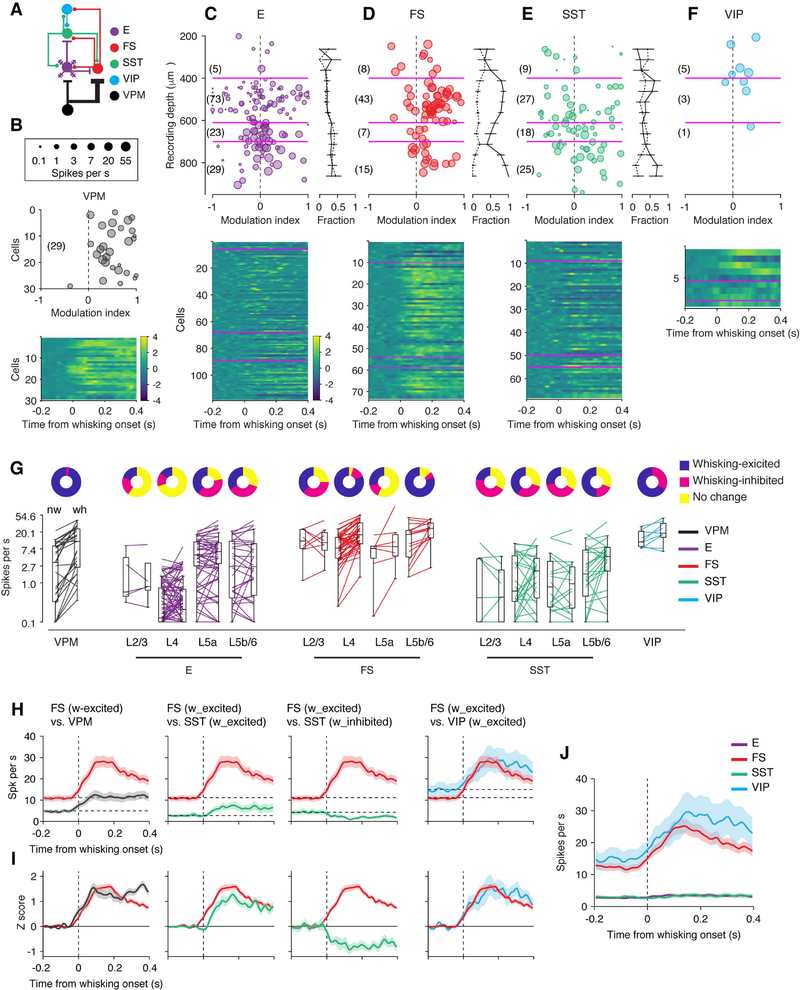
Figure 6. Whisking-Evoked Responses Across Cell Types and Layers.
(A) Connectivity diagram.
(B) Top, modulation index for individual VPM neurons. The size of the marker corresponds to the spike rate, averaged between whisking and non-whisking periods. Bottom, averaged responses (z-scored) for individual neurons aligned to the start of whisking bouts.
(C) Top left, modulation index for E neurons as a function of recording depth. The size of the marker corresponds to the spike rate. Right, the proportion of neurons excited by whisking (solid line) and those inhibited by whisking (dashed line) calculated in running windows (125 μm window, 50 μm step). Error bar denotes standard error. Bottom, averaged responses (z-scored) for individual neurons aligned to the start of whisking bouts.
(D) Same as C for FS neurons.
(E) Same as C for SST neurons.
(F) Same as C for VIP neurons.
(G) Changes in spike rate with whisker movements for individual cells, arranged by cell types and layers. Pie charts, the fraction of cells that are excited (blue), inhibited (red), or show no change in spike rate (yellow) to whisking.
(H) Spike rate changes aligned to start of whisking bouts for VPM (n = 29), FS (L4 and L5b/6, whisking-excited, n = 47), SST (L4 and L5b/6, whisking-excited, n = 24, whisking-inhibited, n = 13), and VIP neurons (n = 9), plotted pairwise for ease of comparison. Cells excited by whisking are plotted separately from cells inhibited by whisking.
(I) Same as H with z-scored spike rate.
(J) Grand-averaged PSTHs of E (n = 153), FS (n = 73), SST (n = 80), and VIP (n = 9) neurons.
See also Figure S5.

