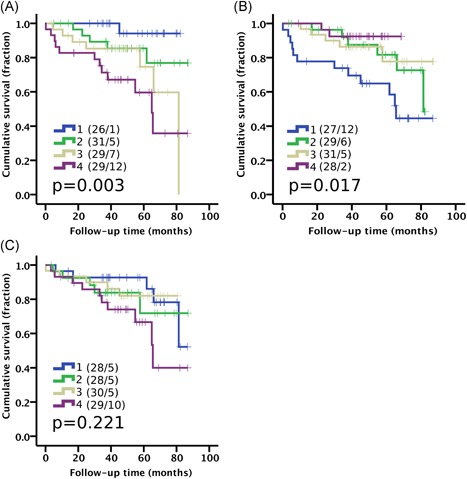
Figure 4.

High proportion of fibroblasts and low proportion of smooth muscle cells predicts prostate cancer‐specific mortality. Kaplan‐Meier analysis using quartile categories (1‐4) for the proportion of stromal (A) fibroblast, (B) smooth muscle, and (C) myofibroblasts. Number of patients and events are presented in brackets. Log‐rank test. Cohort I (n = 115) [Color figure can be viewed at wileyonlinelibrary.com]
