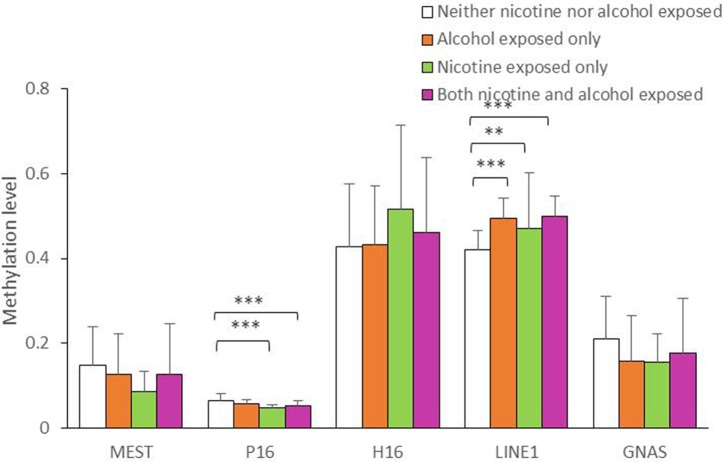
Figure 1.
Average methylation level of the five genes in all the subjects. The comparison of average methylation levels at MEST, P16, H19, LINE1, and GNAS in human sperms of 143 minority male residents, respectively. Data are means ± SD. Statistically significant differences are represented with asterisks: **P < 0.01, ***P < 0.001. Not significant, P > 0.05.

