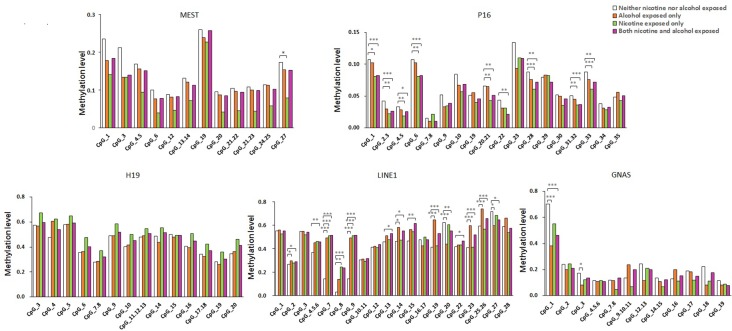
Figure 2.
Methylation level of the five genes in all the subjects. The comparison of site-specific methylation levels at MEST, P16, H19, LINE1, and GNAS DMR of the neither nicotine- nor alcohol-exposed controls (N = 48) with alcohol-exposed only cases (N = 16), nicotine-exposed only cases (N = 16), both nicotine- and alcohol-exposed cases (N = 63), respectively. The data are the geometric mean ratios of methylation levels at each CpG site. *P < 0.05, **P < 0.01, ***P < 0.001. Not significant, P > 0.05

