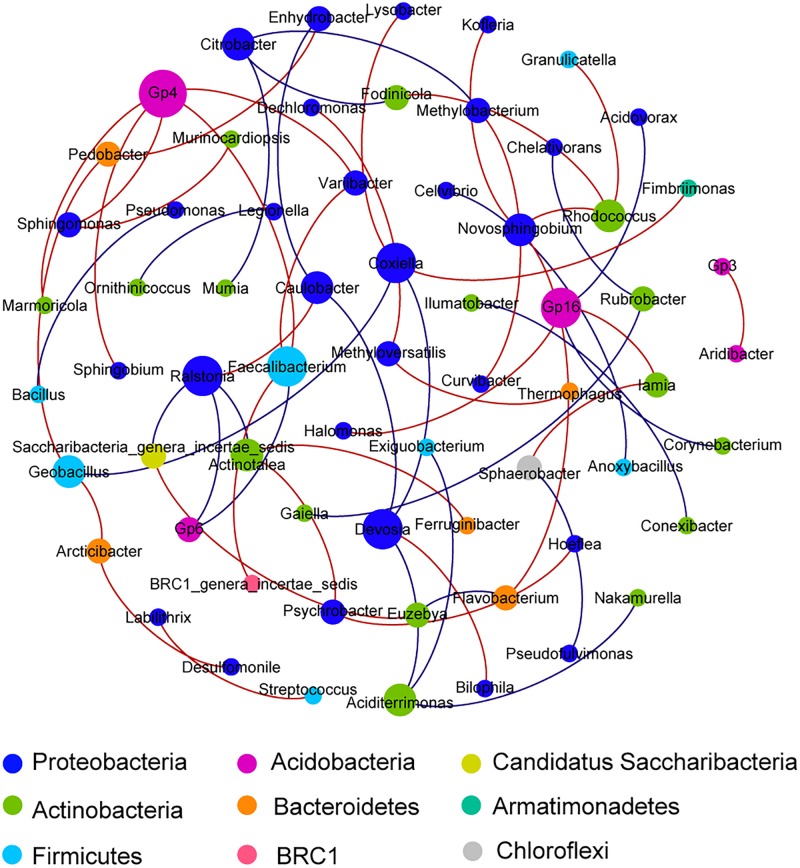
FIGURE 4.
A network of co-occurrence pattern at genus level from all samples. Each line represents a significant correlation between two nodes; the red lines represent positive correlations, while the blue lines represent negative correlations. The size of each node is proportional to the number of connections. Correlations were identified by SparCC’s coefficient >0.65 or <−0.65 and P < 0.01, with each node representing a bacterial genus and the color representing the phylum that the genus is affiliated with.

