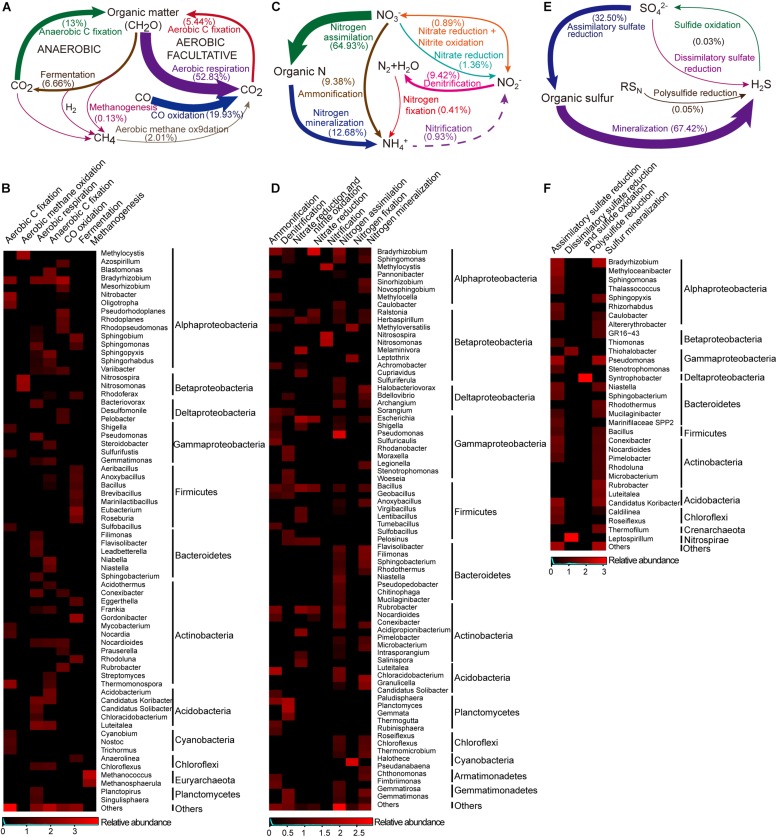
FIGURE 5.
The carbon, nitrogen and sulfur cycles and their major taxa in the Union Glacier area. The genetic potential for each conversion step was estimated using a combination of normalized marker genes (Supplementary Table S1). Arrow size is proportional to the total potential flux (Supplementary Table S6). Heatmap presented the relative abundances of major microbes (only for those that contributed >1% of the marker genes mixture) potentially driving each conversion step. Color bars represent the row-scaled value, in which a blue curve illustrates the distribution density percentage. (A) Carbon cycle and (B) its major taxa. (C) Nitrogen cycle and (D) its major taxa. Dotted lines represent not detected marked genes but putative presence of the pathway. (E) Sulfur cycle and (F) its major taxa.

