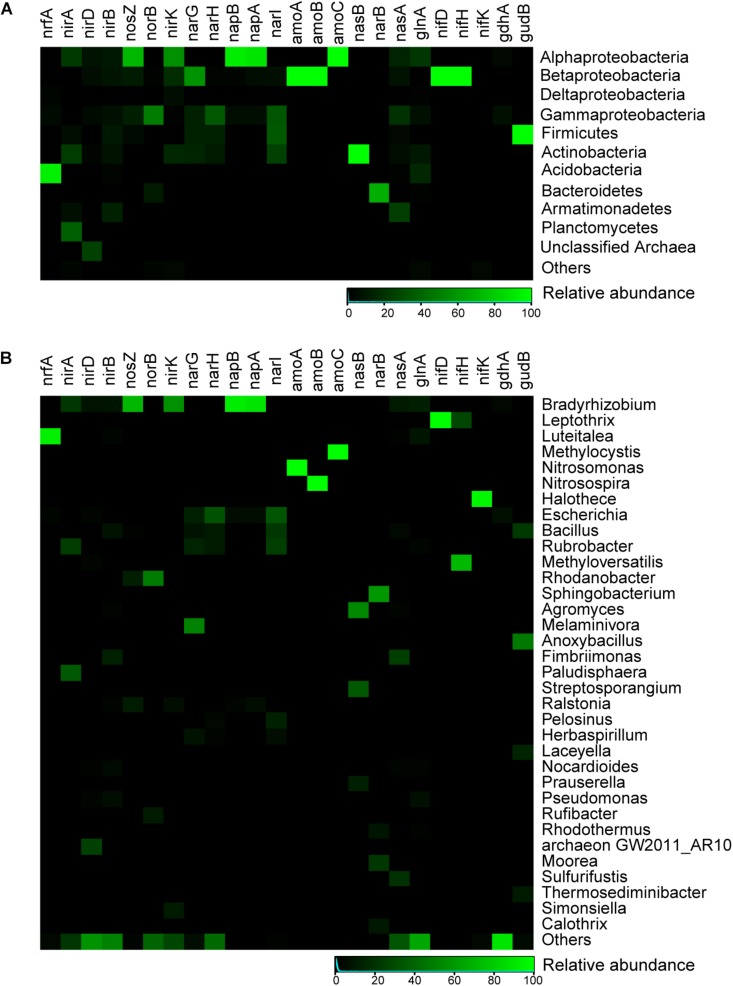
FIGURE 6.
Heatmap showing relative abundances for main microbial taxa of selected key genes related to nitrogen metabolism in the Union Glacier area. (A) At the phylum level. (B) At the genus level. Color bars represent the row-scaled value, in which a blue curve illustrates the distribution density percentage.

