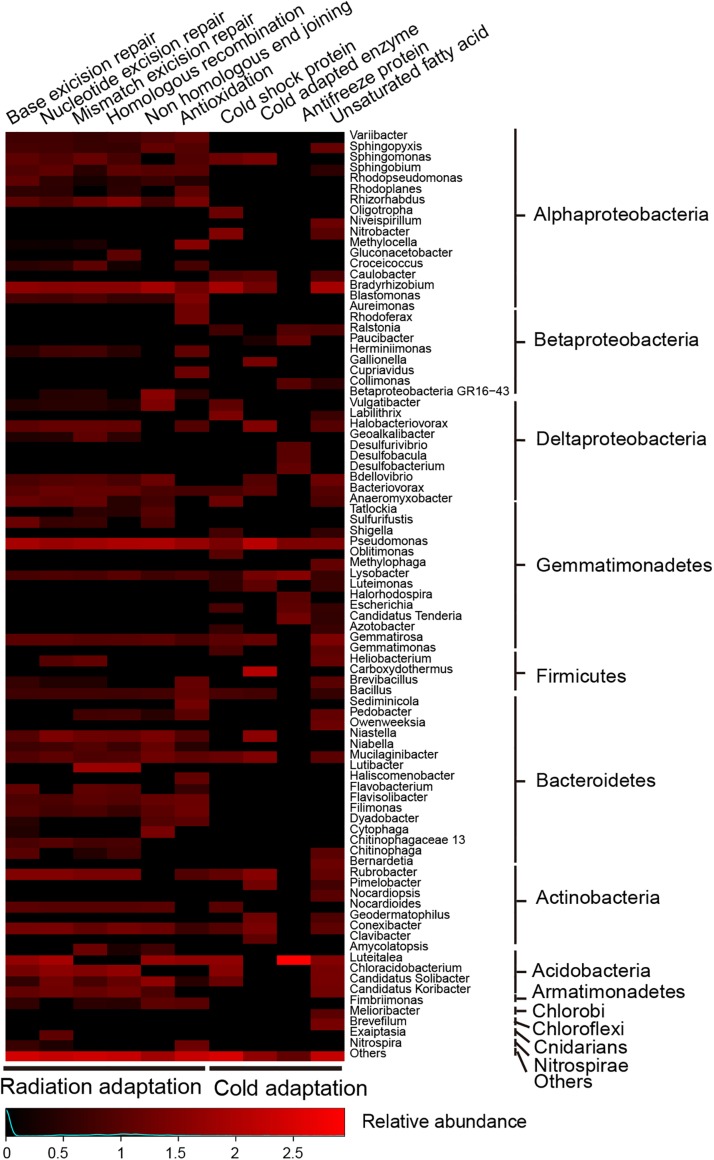
FIGURE 7.
Heatmap showing relative abundances for main microbes (only for those that contributed >1% of the marker genes mixture) potentially driving DNA repair, antioxidation and cold adaption to an extremely low temperature in the Union Glacier area. Color bars represent the row-scaled value, in which a blue curve illustrates the distribution density percentage.

