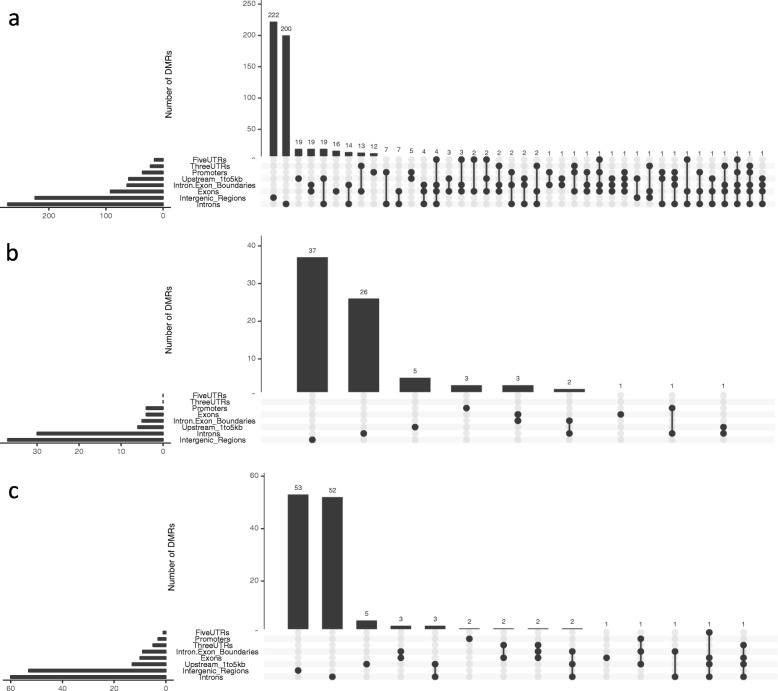
Fig. 1.
Genomic distribution of DMRs. DMRs based on (a) CpG, (b) CHG and (c) CHH were annotated to the up-to-date human genome separately. The heights of the bars in the graph indicate numbers of DMRs identified with a given genomic annotation configuration. The x-axis displays different annotation configurations. The dots under the bar graph together with the adjacent horizontal histogram display the configurations and their frequency. FiveUTR: 5′ UTR; ThreeUTR: 3′ UTR; Promoter: < 1 kb upstream of the transcription start site (TSS); Upstream_1to5kb: 1-5 kb upstream of the TSS; Intergenic_Region: > 5 kb upstream of the TSS. For example, in (a), the rightmost element in the display shows that 1 DMR was identified spanning at least one of each of these elements: 1-5 kb upstream region, exon, intron-exon boundary, and intron

