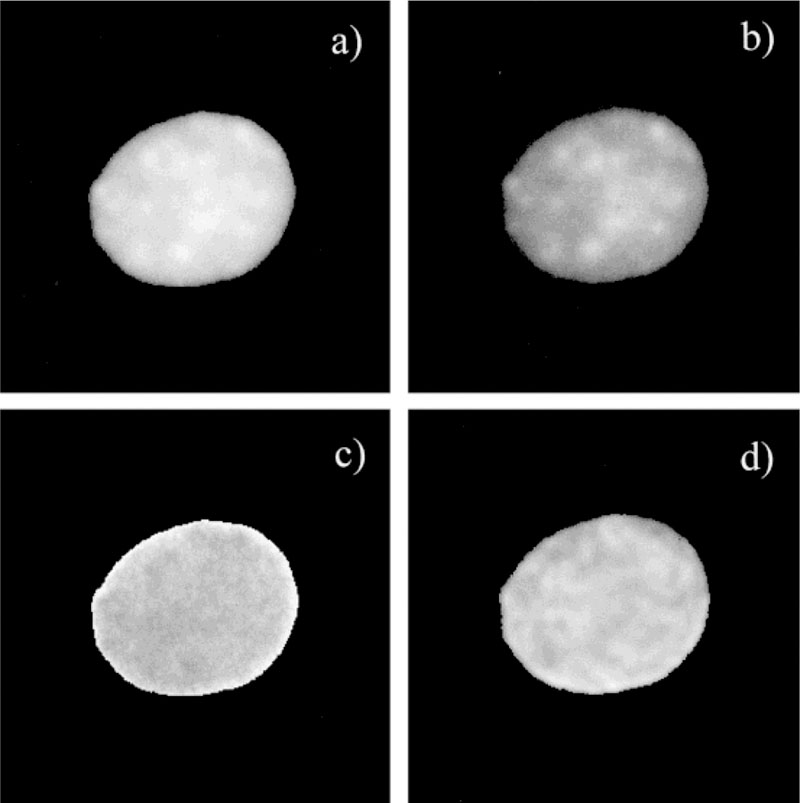
FIG. 8.

Fluorescence intensity, ratio, and lifetime images of Ho. a: Fluorescence intensity image in the absence of 7-AAD. b: Fluorescence intensity image in the presence of 7-AAD. c: Ratio of the image in (b) over the image in (a). d: Modulation lifetime in the presence of 7-AAD (this image is smoothed). Both lifetime and ratio images show a homogeneous pattern. The correlation between fluorescence intensity image (b) and modulation lifetime image (d) in the presence of 7-AAD is very weak.
