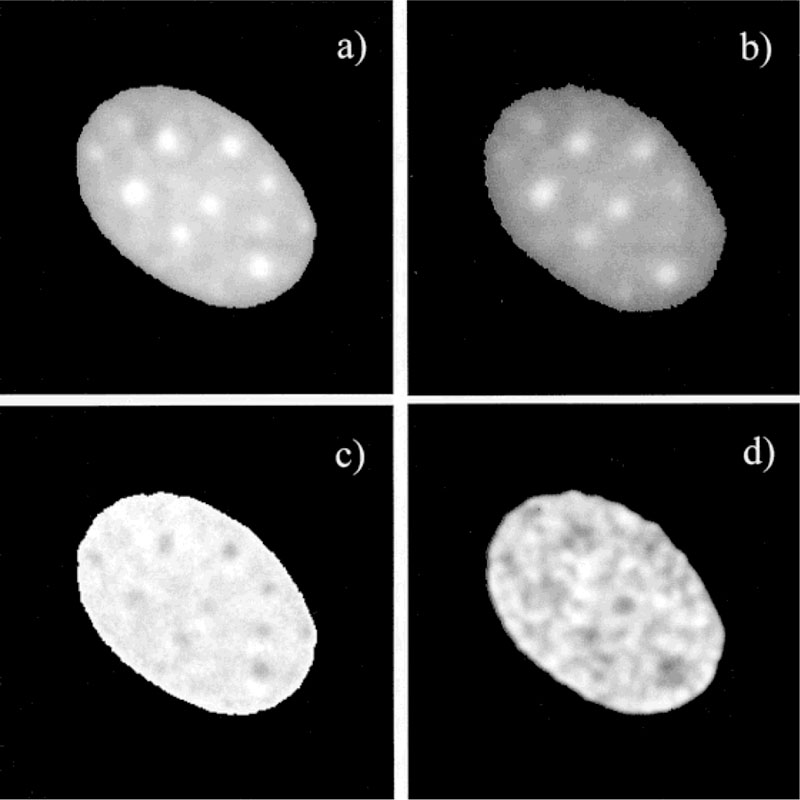
FIG. 9.

Fluorescence intensity, ratio, and lifetime images of Ho. a: Fluorescence intensity image in the absence of 7-AAD. b: Fluorescence intensity image in the presence of 7-AAD. c: Ratio image in (b) over the image in (a). d: Modulation lifetime in the presence of 7-AAD This image is smoothed for better recognition of dark spots. The regions with high efficiency of energy transfer, which are shown as dark spots in image (c), correspond with short lifetimes in image (d). The short lifetime spots and long lifetime areas in (d) are about 1.2 ± 0.05 and 1.70 ± 0.06 ns, respectively.
