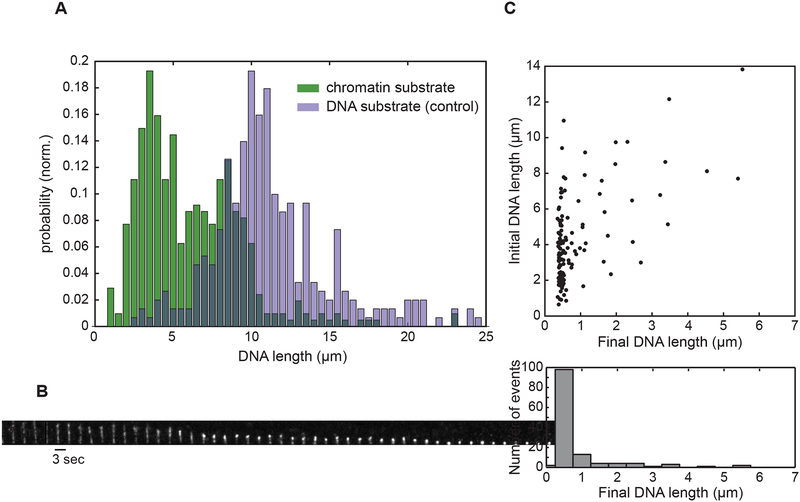
Figure 7. MORC-1 compacts chromatin.
(A) Distribution of substrate lengths under flow. Mode of DNA substrates (n=301) = 10.03 μm; Mode of chromatin substrates (n=415) = 2.84 μm. Substrates were flowed into the flow cell and subsequently visualized with 3 μM SYTOX Orange. (B) Kymograph depicting MORC-1 mediated compaction of a chromatinized template. Scale bars represent 7 μm and 3 seconds, respectively. [MORC-1] = 75 nM. (C) MORC-1 compacts chromatinized substrates of varying lengths. [MORC-1] = 75 nM was flowed into the flow cell and compaction was allowed to proceed. Upper panel; scatter plot of individual trajectories plotted by the initial and final lengths. Bottom panel; projection of the scatter plot, binning the trajectories by final DNA length.

