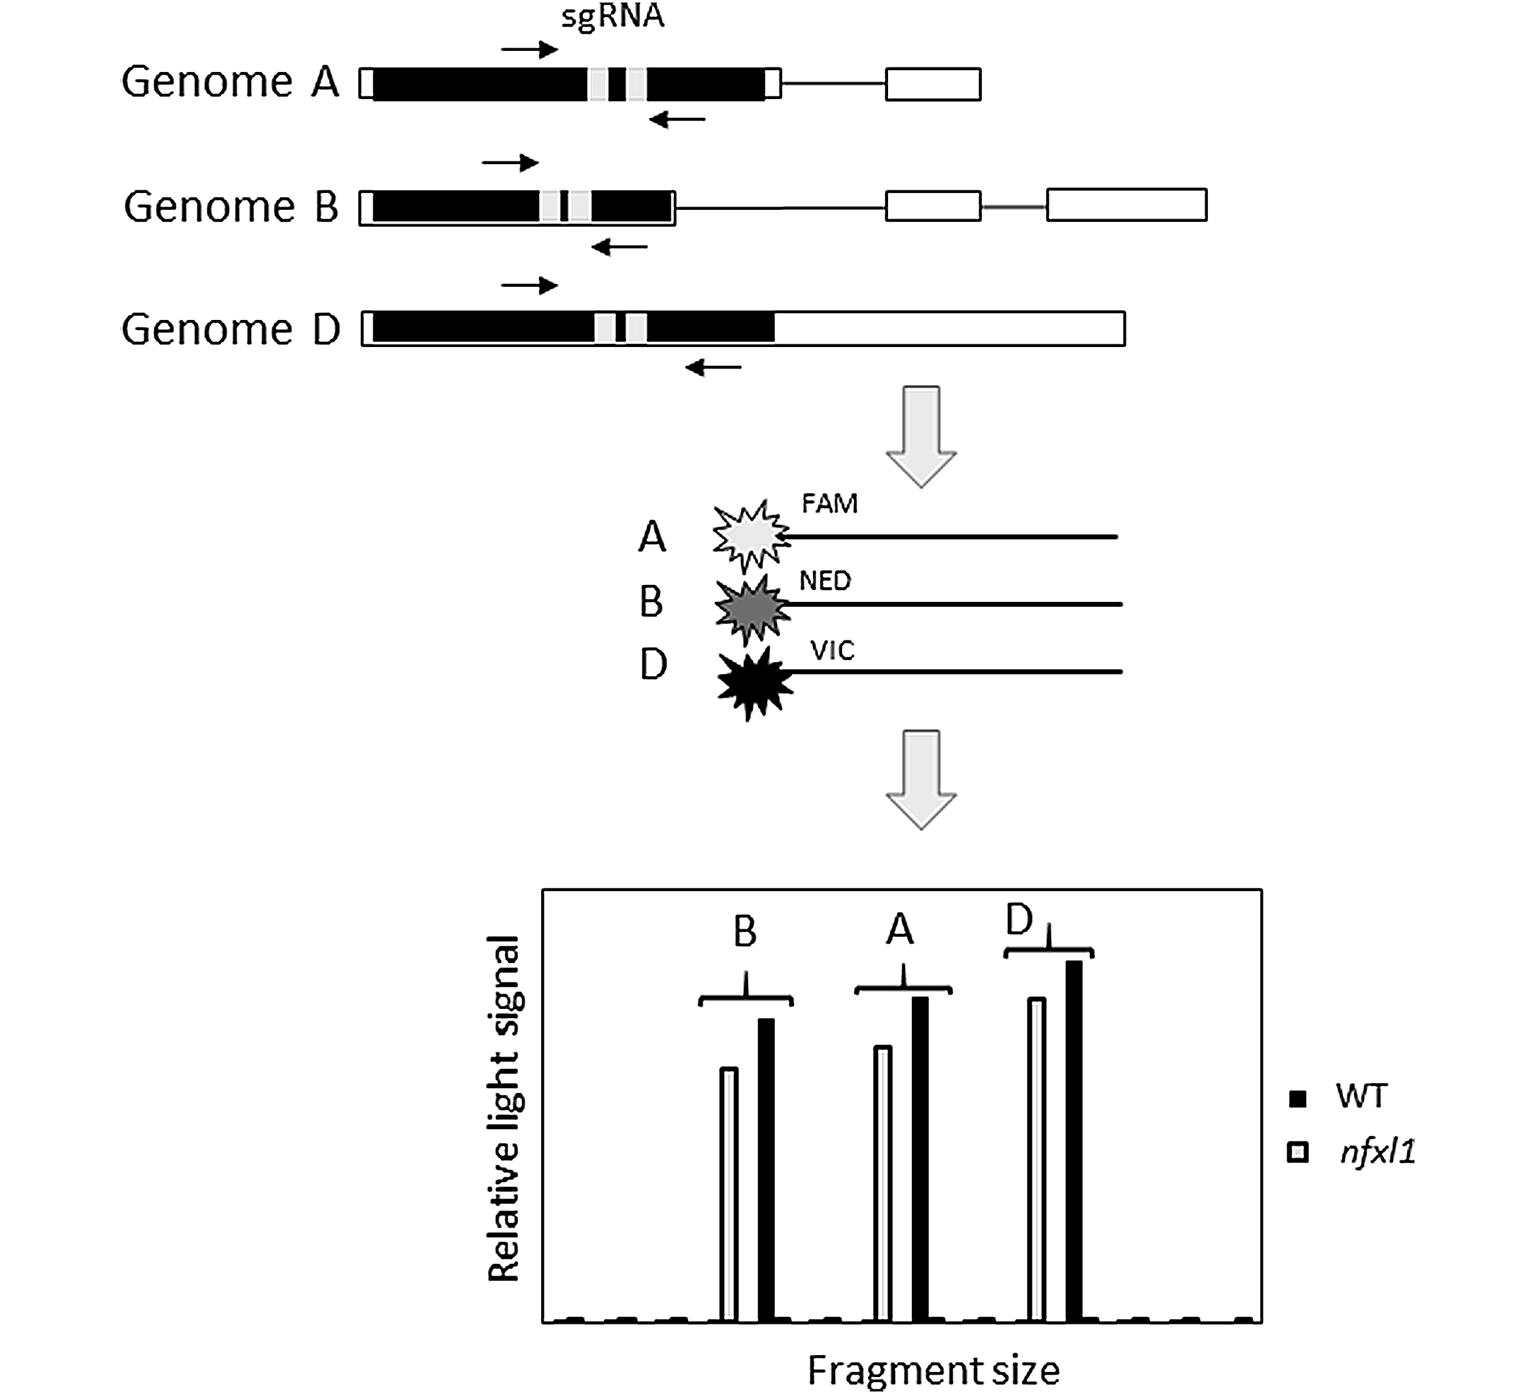
Fig. 2.

Schematic representation of the genotyping protocol to detect CRISPR editing events in wheat genes. Rows starting with Genome A, B and D illustrate the three homoeologous genes with the best match to TaNFXL1, with black and white boxes representing coding and non-coding exons respectively, horizontal lines introns and light grey boxes sgRNA positions. Horizontal arrows indicate the position of the homoeolog-specific PCR primers used for the first round of PCR. FAM, NED and VIC fluorescent dyes were used in a second PCR amplification to label the amplicons from the homoeologs on subgenomes A, B and D respectively. The bottom panel is a schematic representation of an electropherogram depicting possible results for non-edited (WT) and CRISPR-edited (nfxl1) homoeologs from subgenomes A, B and D
