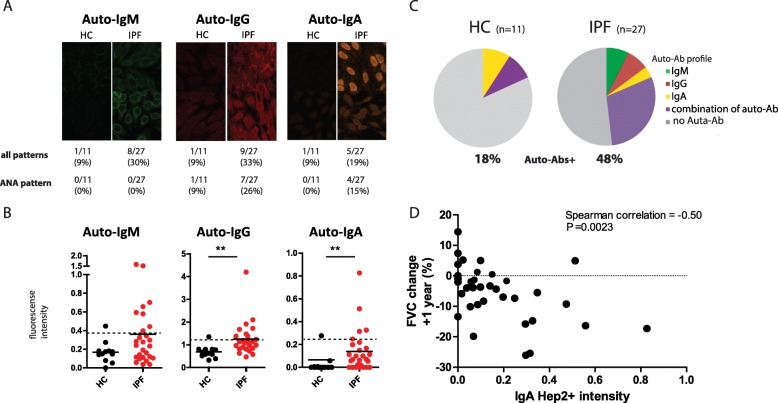
Fig. 5.
Autoreactive IgA and IgG levels are higher in IPF and autoreactive IgA correlates with disease progression. (a) Total IgM, IgG, and IgA in plasma of IPF patients and HCs. (b) Representative staining pattern of human epithelial cells (HEp)-2 slides with plasma of HC or IPF patients. First row describes the number and percentage of patients with a positive staining and second row number and percentage of patients with a specific antinuclear antibody (ANA) staining pattern. (c) Indirect quantification of auto-reactive immunoglobulins levels depicted as fluorescence intensity for autoreactove-IgM, IgG and IgA assessed with HEp-2 staining. The fluorescence intensity of HEp2 slides was evaluated in an automated and thus independent manner. The fluorescence intensity was corrected for number of HEp-2 cells per slide. A positive HEp-2 result was set on 2x standard deviation above the mean of the HC for each immunoglobulin subtype (see also additional methods 1) (d) Pie-chart of percentage of HC or IPF patients with detectable autoreactive antibodies and subclass (IgM, IgG and IgA (or combination)). (e) Increased fluorescence intensity for plasma autoreactive IgA correlate with decline in forced vital capacity (FVC) over 1-year period. Data of 12 IPF patients (with multidisciplinary diagnosis (MDD) of definitive or probable IPF) were used from our original cohort of 27 patients. 3 patients in the original cohort died within one year and could not be used for this analysis. Correlation coefficients were calculated using Spearman’s rank method. Non-parametric two-tailed Mann-Whitney test was used. Data are expressed as mean and dots represent individual patient values. * P < 0.05 ** P < 0.01

