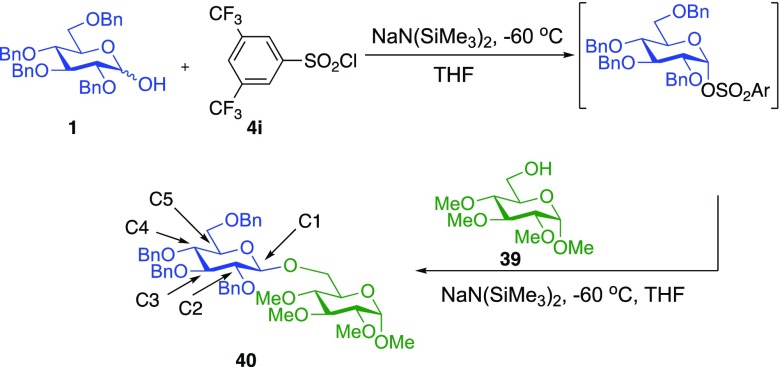
Table 7. Predicted vs Experimental Isotope Effectsa.
| SN2 KIEs |
|||||
|---|---|---|---|---|---|
| SN1 EIEs | type a | type b | type c | expt | |
| C1 | 1.001 | 1.082 | 1.036 | 1.066 | 1.034 |
| C2 | 1.020 | 1.004 | 1.007 | 1.001 | 1.005 |
| C3 | 1.007 | 1.001 | 1.002 | 0.999 | 1.000b |
| C4 | 1.005 | 1.001 | 1.002 | 1.000 | 1.002 |
| C5 | 1.018 | 1.001 | 1.006 | 1.002 | 0.998 |
Only the type b SN2 transition states gave KIE predictions that were in good agreement with experiment. Predictions for the lowest-energy representative of each class are shown. These predictions include a Bell tunneling correction.
The KIE at C3 position is assumed to be 1.000.

