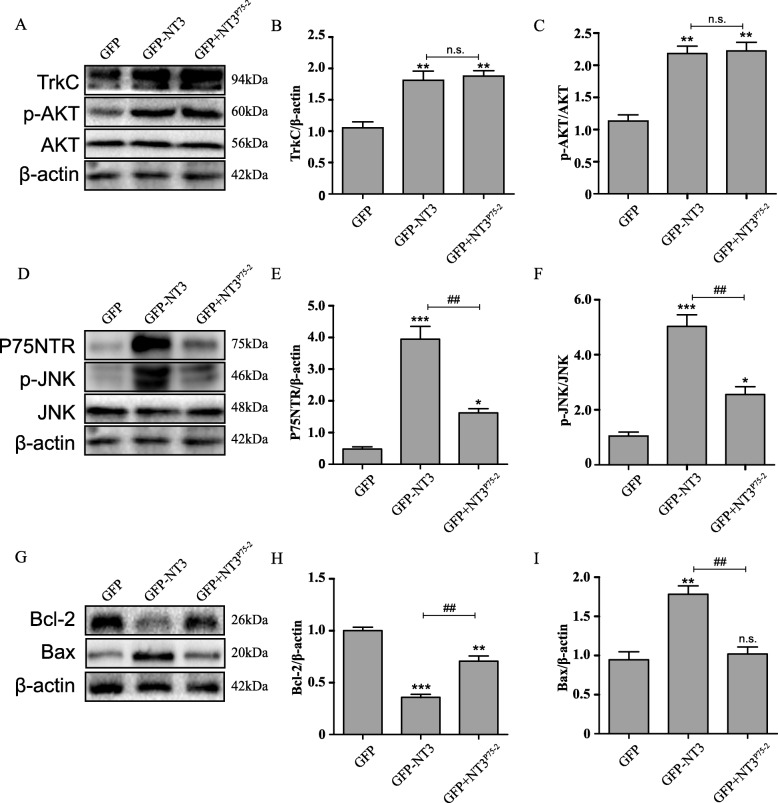
Fig. 3.
NT3P75-2 overexpression induces TrkC pathway activation while reducing the activation of P75NTR signal in PC12 cells. a–c Western blot analysis of the protein levels of TrkC, AKT, p-AKT, and β-actin. Quantification of TrkC and p-AKT protein expression levels (**P < 0.01 by one-way ANOVA followed by Bonferroni’s multiple comparison test; n.s., no significance, n = 3). d–f Western blot analysis of the protein levels of P75NTR, JNK, p-JNK, and β-actin. Quantification of P75NTR and p-JNK protein expression levels (##P < 0.01, *P < 0.05, ***P < 0.001 by one-way ANOVA followed by Bonferroni’s multiple comparison test, n = 3). g–i Western blot analysis of the protein levels of Bcl-2, Bax, and β-actin. Quantification of Bcl-2 and Bax protein expression levels (##P < 0.01, **P < 0.01, ***P < 0.001 by one-way ANOVA followed by Bonferroni’s multiple comparison test; n.s., no significance, n = 3)

