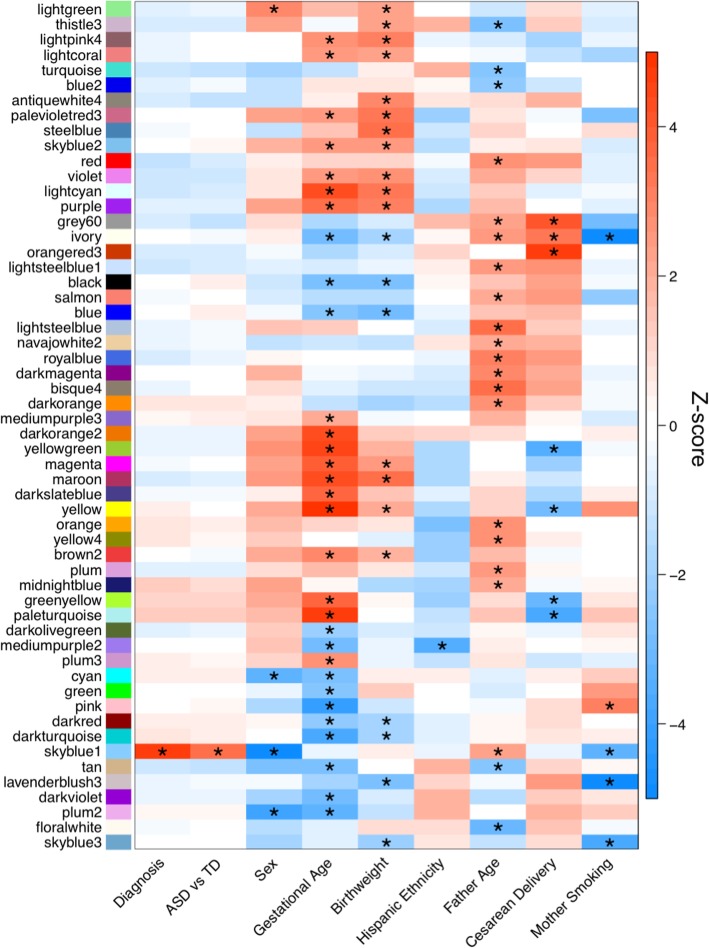
Fig. 6.
Consensus modules are correlated with diagnosis and demographic factors in meta-analysis. Heatmap of meta-analysis biweight midcorrelation Z-scores of module eigengenes with sample covariates (MARBLES: ASD n = 41, Non-TD n = 44, TD n = 76; EARLI: ASD n = 19, Non-TD n = 47, TD n = 43). Z-scores from the individual studies were combined using Stouffer’s method with weights given by the square root of sample n. p values were adjusted for all comparisons shown in Additional file 1: Figure S16 using the FDR method (*q < 0.05). Modules and covariates with significant correlations are shown

