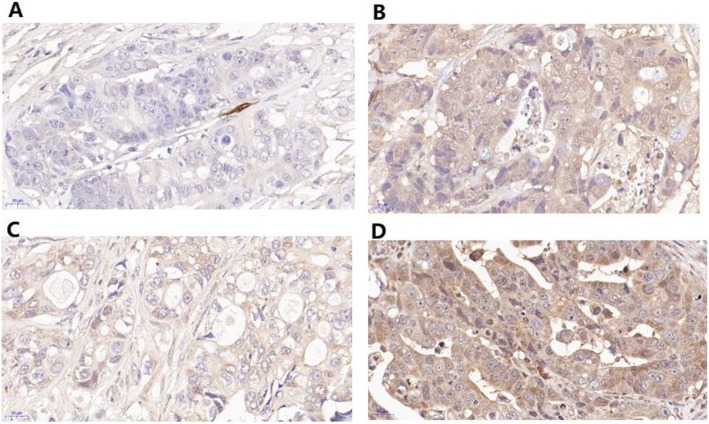
Fig. 2.
The comparison of the protein expressions of FABP4 and FABP6 between tumor tissues and adjacent tissues by IHC. The majority of the stain was observed in cancer cells. The average optical density of the colorectal tumor tissue sections was higher than that of the adjacent tissues (0.827 ± 0.114 vs 0.195 ± 0.025, P < 0.001). a Adjacent tissues FABP4. b Tumor tissues FABP4. c Adjacent tissues FABP6. d Tumor tissues FABP6

