Fig. 1.
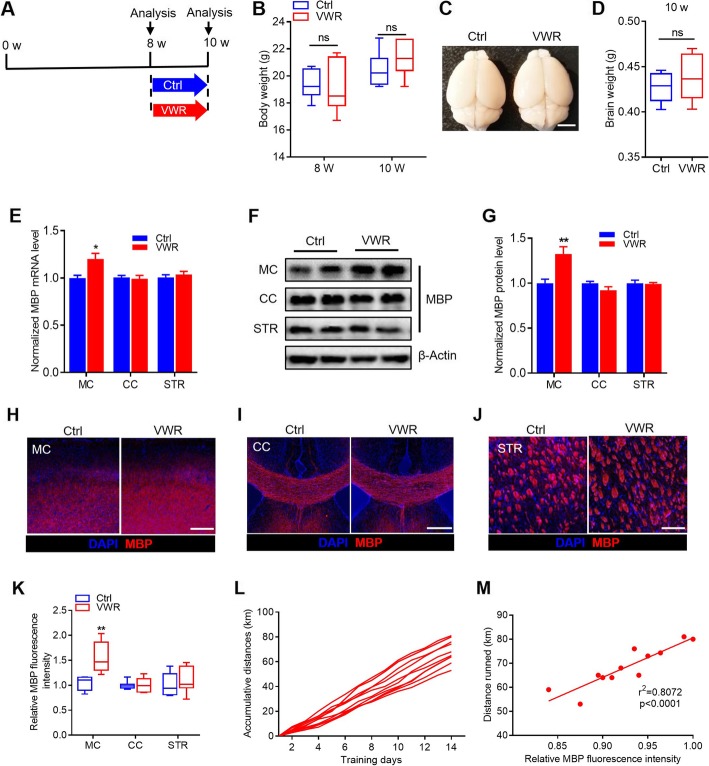
Voluntary wheel running (VWR) accelerates myelination in the motor cortex. a Time course schema for animal treatment and testing. b Body weight of Control (Ctrl) and VWR mice. n = 7 per group. ns, p > 0.05, unpaired Student’s t-test. c Brains removed from Ctrl and VWR mice. Scale bar = 5 mm. d Brain weight of Ctrl and VWR mice. n = 7 per group. ns, p > 0.05, unpaired Student’s t-test. e mRNA levels of MBP in different brain regions of Ctrl and VWR mice. n = 6 per group. *p < 0.05 vs Ctrl, unpaired Student’s t-test. f, g Protein levels of MBP in different brain regions of Ctrl and VWR mice. n = 6 per group. **p < 0.01 vs Ctrl, unpaired Student’s t-test. h-j Confocal images of MBP staining in different brain regions of Ctrl and VWR mice. Scale bar = 500 μm. k Quantitative analysis of the relative MBP fluorescent intensity in different brain regions of Ctrl and VWR mice. n = 7 per group. **p < 0.01 vs Ctrl, unpaired Student’s t-test. l Accumulative running distances on the wheel of individual mice with training. m Correlation analysis between relative MBP fluorescence intensity in the motor cortex and running distances. Data are presented as mean ± SEM or minimum to maximum. MC, motor cortex; CC, corpus callosum; STR, striatum

