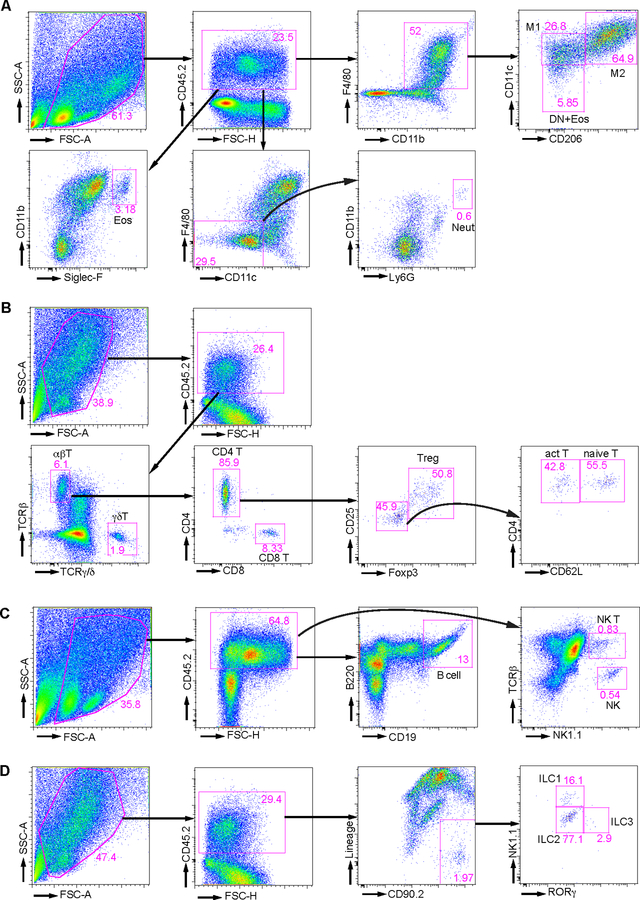
Figure 2. Gating strategy for FACS analysis of AT immune cell subsets.
Typical FACS plots generated from (A) Antibody cocktail #1, myeloid cells; (B) Antibody cocktail #2, T cell subsets; (C) Antibody cocktail #3, B cell, NK cell, and NK T cell; and (D) Antibody cocktail #4, innate lymphocytes. M1: M1 adipose tissue associated macrophage. M2: M2 adipose tissue associated macrophage. DN: double negative adipose tissue associated macrophage. Eos: eosinophil. Neut: neutrophil. Treg: regulatory T cell. Naïve T: naïve CD4+ T cell. Act T: activated CD4+ T cell. NK: natural killer cell. NK T: natural killer T cell. ILC1: group 1 innate lymphocyte. ILC2: group 2 innate lymphocyte. ILC3: group 3 innate lymphocyte.

