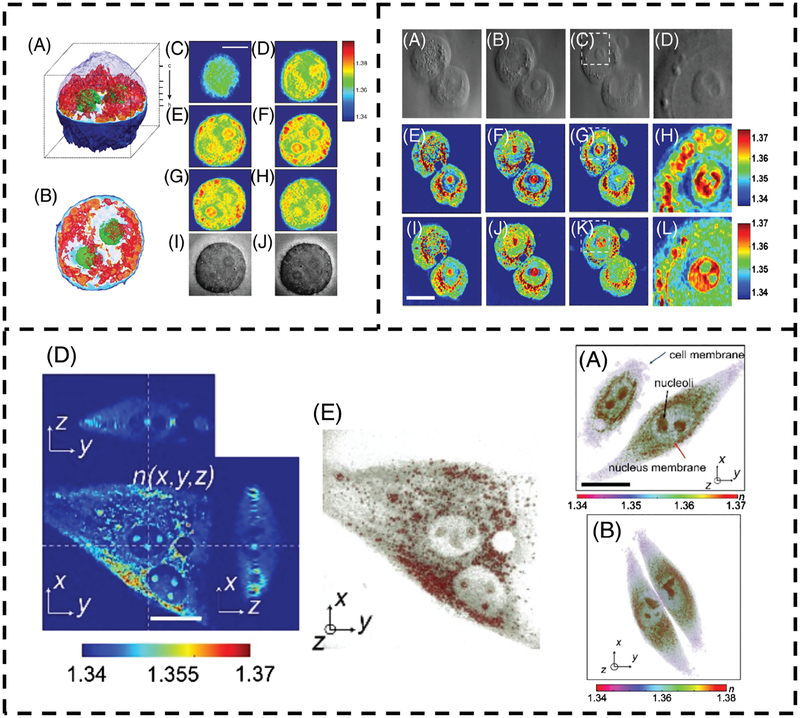
FIGURE 1.
(Top Left) Refractive index tomogram (A, B) and tomogram slices (C-H) from Choi et al. [3] showing a HeLa cell. The nucleus is visibly less dense than the cytoplasm. Brightfield images are shown in (I, J). (Top Right) Optical diffraction tomogram slices of HT29 cells from Sung et al. [17] with corresponding brightfield images on the top row. The middle and bottom rows represent different image reconstruction algorithms. In each case, the nucleus is visibly less dense than the perinuclear region. (Bottom) Tomographic slice (D) and 3D-rendering (E) of the refractive index distribution of an NIH-3 T3 cell from Kim et al. [13]. 3D renderings of HeLa cell RI distributions (A, B) are also displayed. In each case, the perinuclear region is more optically dense than the nucleoplasm. Subfigure lettering is referenced to the original work. Reproduced with permission refs. [3, 13, 17]. 2007, Springer Nature and 2017, 2009, The Optical Society

