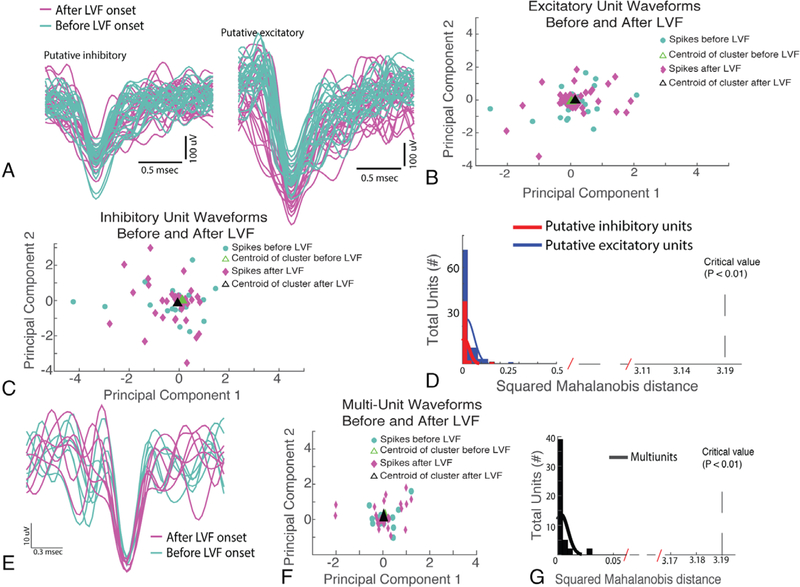
FIGURE 2:
The waveforms of excitatory and inhibitory units remain stable and are unaltered during low-voltage fast (LVF) activity. (A) Examples of inhibitory neuron (left) and excitatory neuron (right) waveforms before (cyan) and after LVF onset (magenta). (B, C) Principal component analysis (PCA) of all the spike waveforms for an excitatory and an inhibitory neuron before (cyan) and after LVF onset (magenta). (D) Histogram of the squared Mahalanobis distance between the centroid of spike clusters in the PCA analysis prior to LVF onset and after LVF onset for all excitatory (blue) and inhibitory (red) neurons recorded in the study. The squared Mahalanobis distance did not meet statistical significance for a change in waveform shape during LVF onset.(E) Representative example of spike waveforms derived using multiunit analysis before (cyan) and after LVF onset (magenta).(F) PCA analysis for the representative multiunit spike waveforms. (G) Histogram of the squared Mahalanobis distance for the multiunit waveforms for >50 distinct local field potential recordings.

