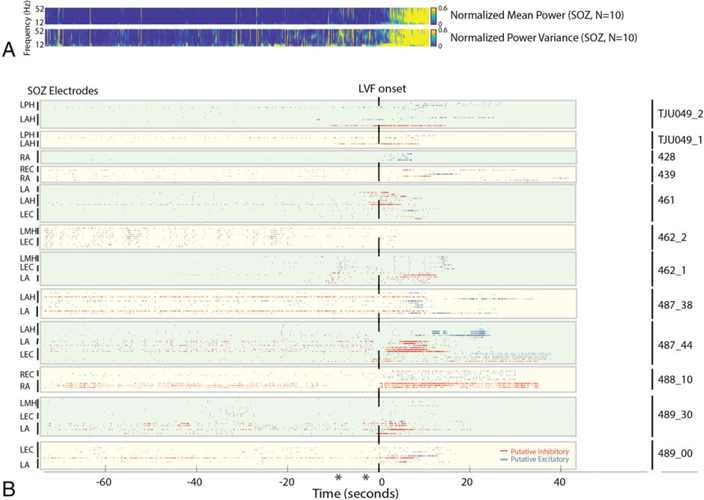
FIGURE 4:
Across all seizures, excitatory and inhibitory neuron firing is heterogeneous, but changes in excitatory and inhibitory balance are evident at the start of low-voltage fast (LVF) seizures in the seizure onset zone (SOZ). (A) Time–frequency plot of the mean normalized power (top) and variance (bottom) prior to and during LVF onset in the local field potential of the SOZ across seizures. (B) Aligned raster plot of 140 units (8 patients, 11 seizures). The seizures are aligned to the onset of LVF activity (dashed vertical line). Note that LVF onset ended at different times for each microelectrode recording. Excitatory neurons in the SOZ are shown in blue; inhibitory neurons in the SOZ are shown in red. Asterisks indicates the time of preictal discharges during the seizures 462_1 and 487_44. LA = left amygdala; LAH = left anterior hippocampus; LEC = left entorhinal cortex; LMH = left middle hippocampus; LPH = left posterior hippocampus; RA = right amygdala; REC = right entorhinal cortex.

